What a time it’s been for Semtech. In the past six months alone, the company’s stock price has increased by a massive 134%, reaching $68.72 per share. This performance may have investors wondering how to approach the situation.
Is there a buying opportunity in Semtech, or does it present a risk to your portfolio? See what our analysts have to say in our full research report, it’s free for active Edge members.
Why Do We Think Semtech Will Underperform?
We’re glad investors have benefited from the price increase, but we're swiping left on Semtech for now. Here are three reasons we avoid SMTC and a stock we'd rather own.
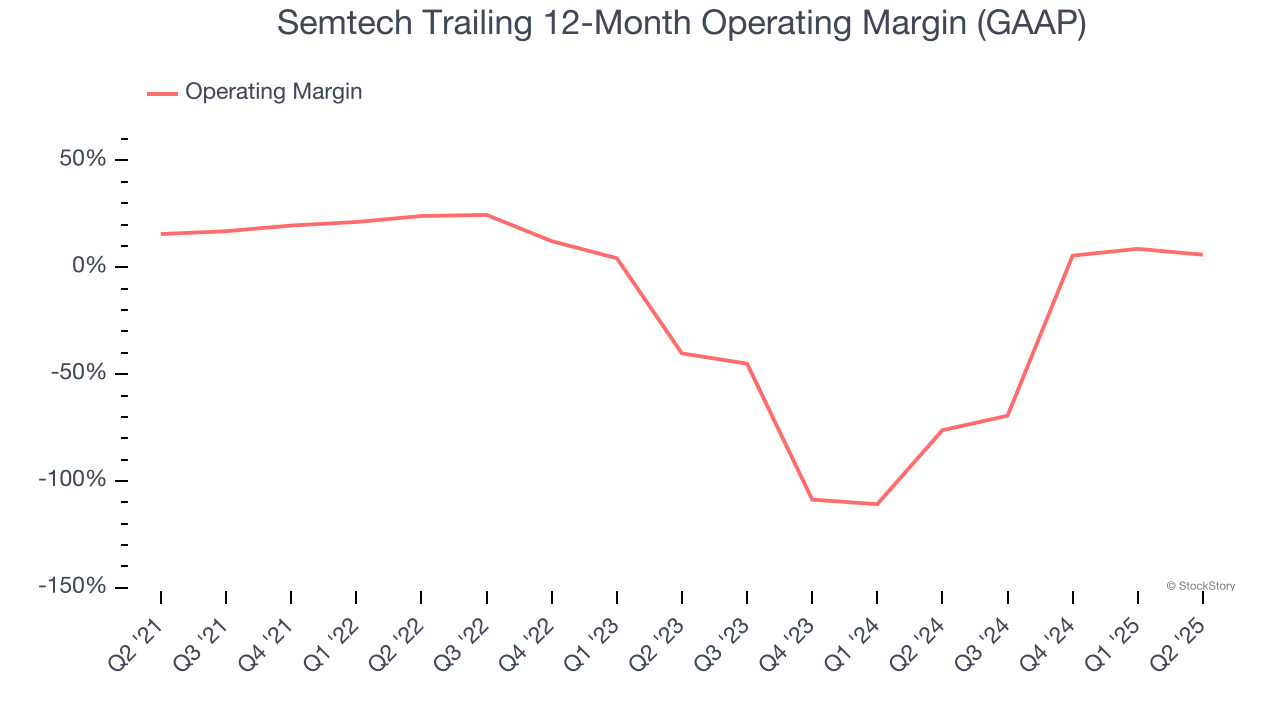
1. Operating Losses Sound the Alarms
Operating margin is a key measure of profitability. Think of it as net income - the bottom line - excluding the impact of taxes and interest on debt, which are less connected to business fundamentals.
Semtech’s high expenses have contributed to an average operating margin of negative 31.1% over the last two years. Unprofitable semiconductor companies require extra attention because they could get caught swimming naked when the tide goes out. It’s hard to trust that the business can endure a full cycle.
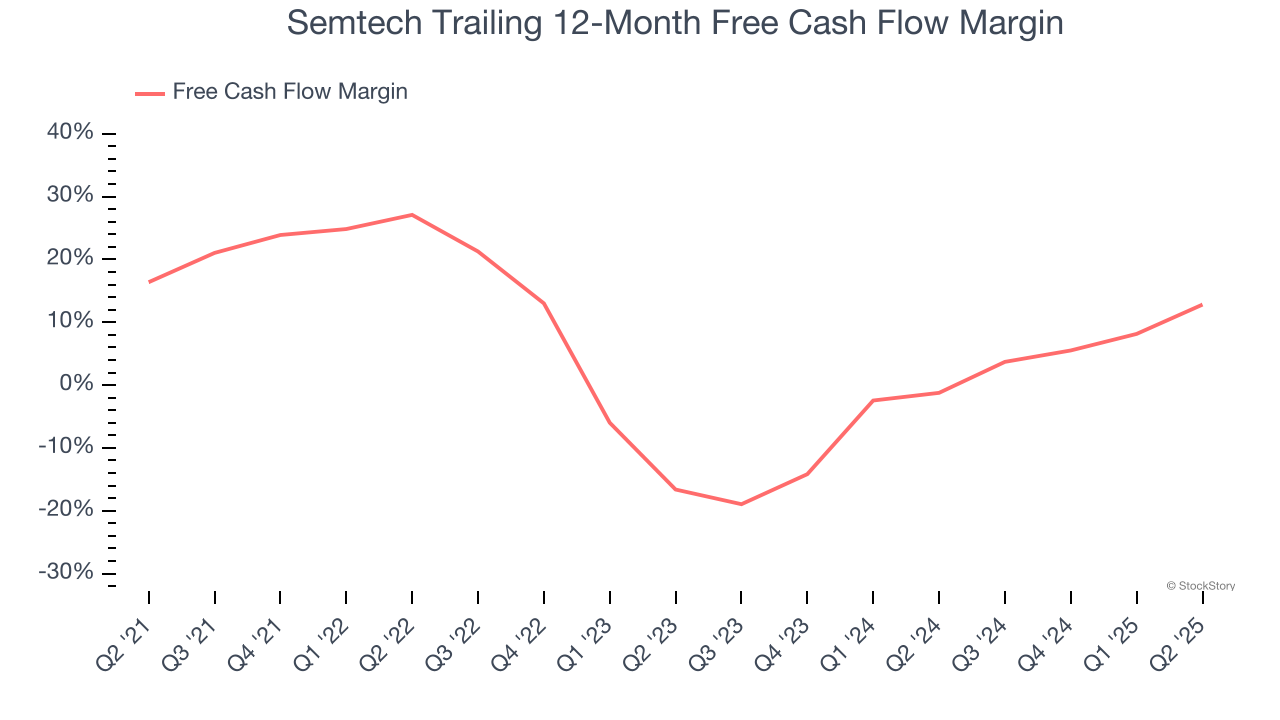
2. Mediocre Free Cash Flow Margin Limits Reinvestment Potential
Free cash flow isn't a prominently featured metric in company financials and earnings releases, but we think it's telling because it accounts for all operating and capital expenses, making it tough to manipulate. Cash is king.
Semtech has shown poor cash profitability over the last two years, giving the company limited opportunities to return capital to shareholders. Its free cash flow margin averaged 6.5%, lousy for a semiconductor business.
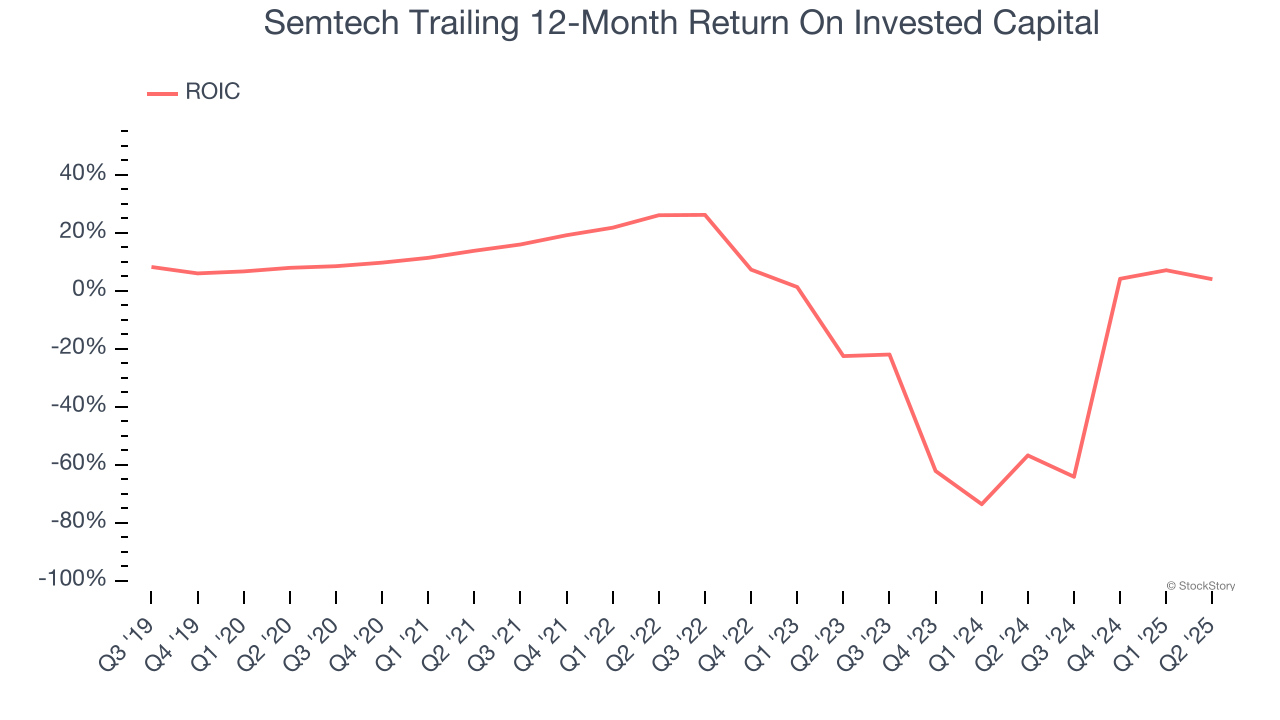
3. Previous Growth Initiatives Have Lost Money
Growth gives us insight into a company’s long-term potential, but how capital-efficient was that growth? A company’s ROIC explains this by showing how much operating profit it makes compared to the money it has raised (debt and equity).
Semtech’s five-year average ROIC was negative 7.1%, meaning management lost money while trying to expand the business. Its returns were among the worst in the semiconductor sector.
Final Judgment
We see the value of companies furthering technological innovation, but in the case of Semtech, we’re out. Following the recent rally, the stock trades at 38.2× forward P/E (or $68.72 per share). At this valuation, there’s a lot of good news priced in - we think there are better stocks to buy right now. We’d suggest looking at a top digital advertising platform riding the creator economy.
High-Quality Stocks for All Market Conditions
Trump’s April 2025 tariff bombshell triggered a massive market selloff, but stocks have since staged an impressive recovery, leaving those who panic sold on the sidelines.
Take advantage of the rebound by checking out our Top 9 Market-Beating Stocks. This is a curated list of our High Quality stocks that have generated a market-beating return of 183% over the last five years (as of March 31st 2025).
Stocks that made our list in 2020 include now familiar names such as Nvidia (+1,545% between March 2020 and March 2025) as well as under-the-radar businesses like the once-micro-cap company Kadant (+351% five-year return). Find your next big winner with StockStory today.
StockStory is growing and hiring equity analyst and marketing roles. Are you a 0 to 1 builder passionate about the markets and AI? See the open roles here.


