
Texas-based commercial bank Stellar Bancorp (NYSE: STEL) met Wall Street’s revenue expectations in Q3 CY2025, but sales fell by 2% year on year to $105.6 million. Its GAAP profit of $0.50 per share was in line with analysts’ consensus estimates.
Is now the time to buy Stellar Bancorp? Find out by accessing our full research report, it’s free for active Edge members.
Stellar Bancorp (STEL) Q3 CY2025 Highlights:
- Net Interest Income: $100.6 million vs analyst estimates of $100.2 million (flat year on year, in line)
- Net Interest Margin: 4.2% vs analyst estimates of 4.1% (6 basis point beat)
- Revenue: $105.6 million vs analyst estimates of $106 million (2% year-on-year decline, in line)
- Efficiency Ratio: 63.7% vs analyst estimates of 66.9% (323.5 basis point beat)
- EPS (GAAP): $0.50 vs analyst estimates of $0.49 (in line)
- Tangible Book Value per Share: $21.08 vs analyst estimates of $20.43 (9.3% year-on-year growth, 3.2% beat)
- Market Capitalization: $1.51 billion
“We are pleased to report strong third quarter results for 2025, highlighted by improved net interest income and margin. We also saw growth in deposits and tangible book value, which further strengthened our balance sheet to support our future,” said Robert R. Franklin, Jr., Stellar’s Chief Executive Officer.
Company Overview
Created through strategic mergers to serve the growing Texas business community, Stellar Bancorp (NYSE: STEL) is a Texas bank holding company that provides commercial banking services primarily to small and medium-sized businesses and professionals.
Sales Growth
Two primary revenue streams drive bank earnings. While net interest income, which is earned by charging higher rates on loans than paid on deposits, forms the foundation, fee-based services across banking, credit, wealth management, and trading operations provide additional income. Over the last five years, Stellar Bancorp grew its revenue at an incredible 19.2% compounded annual growth rate. Its growth beat the average banking company and shows its offerings resonate with customers.
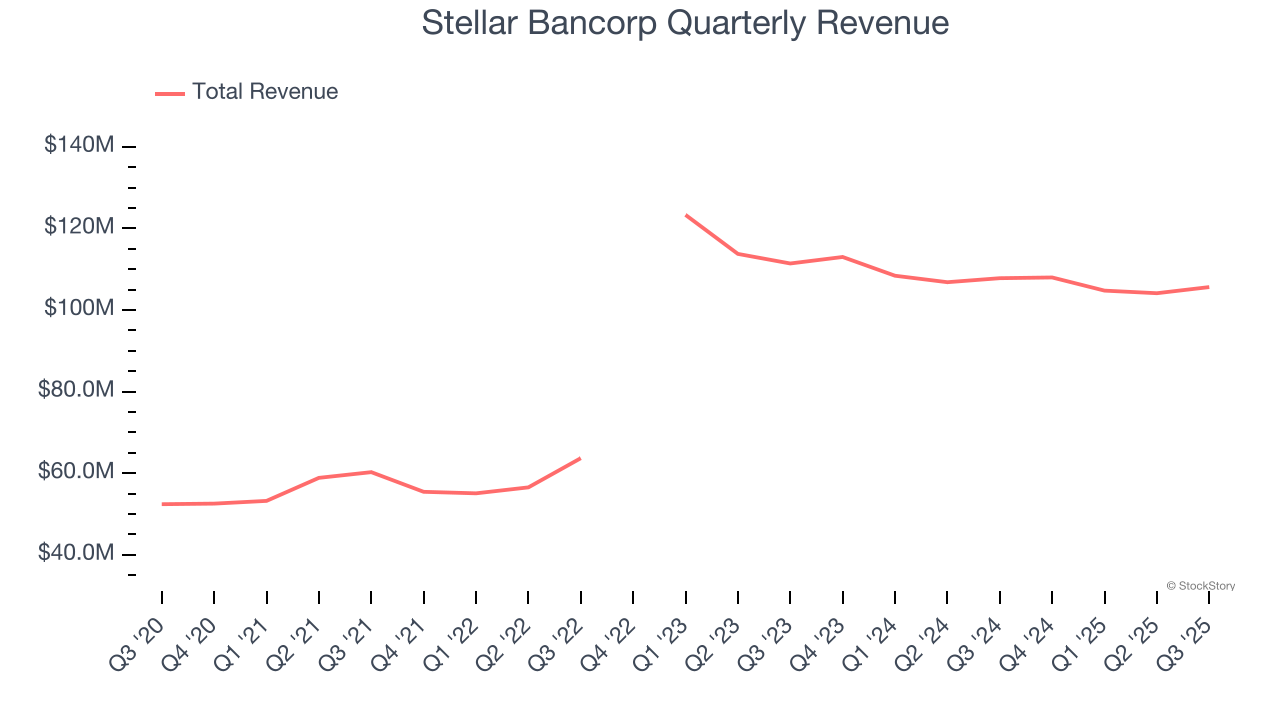 Note: Quarters not shown were determined to be outliers, impacted by outsized investment gains/losses that are not indicative of the recurring fundamentals of the business.
We at StockStory place the most emphasis on long-term growth, but within financials, a half-decade historical view may miss recent interest rate changes, market returns, and industry trends. Stellar Bancorp’s recent performance marks a sharp pivot from its five-year trend as its revenue has shown annualized declines of 5.7% over the last two years. 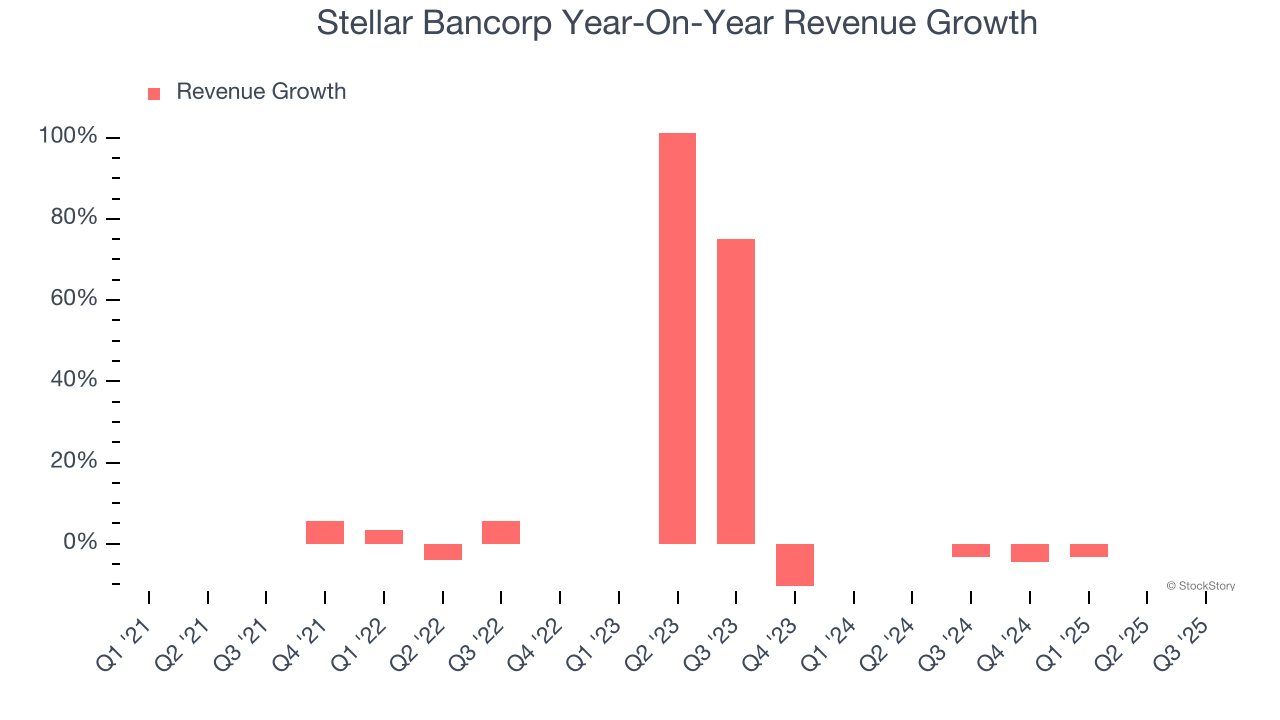 Note: Quarters not shown were determined to be outliers, impacted by outsized investment gains/losses that are not indicative of the recurring fundamentals of the business.
This quarter, Stellar Bancorp reported a rather uninspiring 2% year-on-year revenue decline to $105.6 million of revenue, in line with Wall Street’s estimates.
Net interest income made up 96.8% of the company’s total revenue during the last five years, meaning Stellar Bancorp lives and dies by its lending activities because non-interest income barely moves the needle.
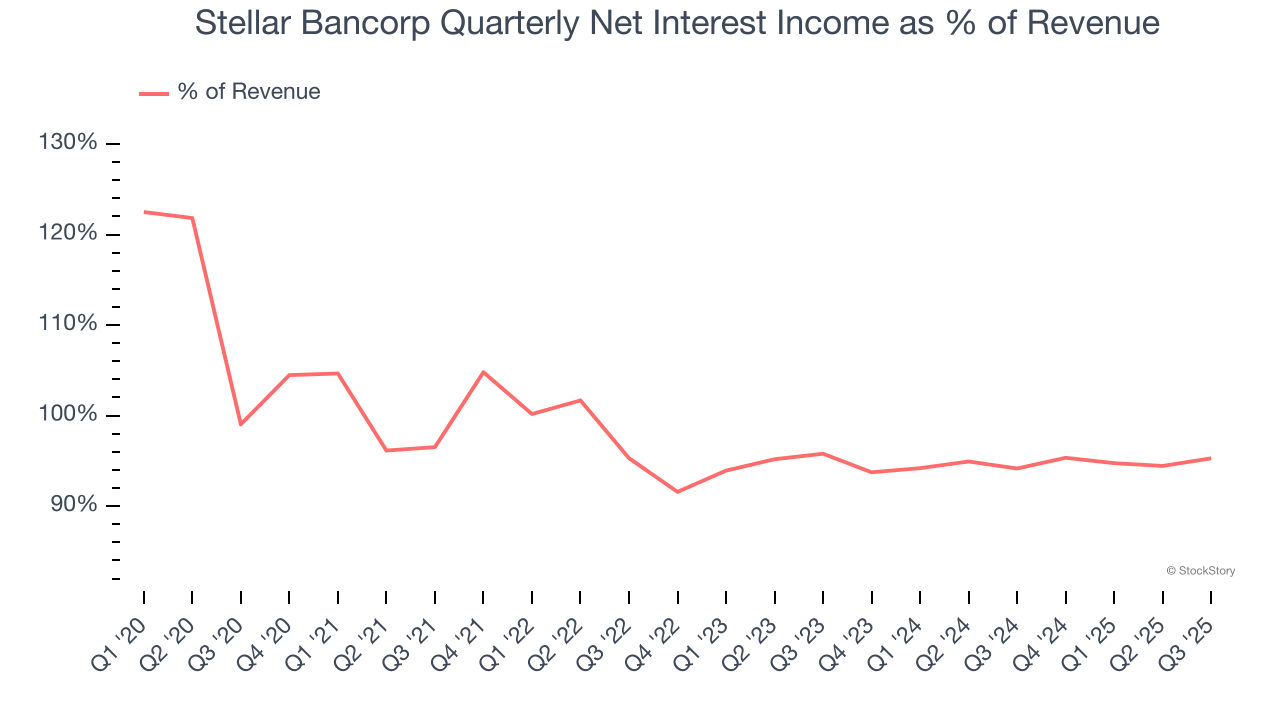
Our experience and research show the market cares primarily about a bank’s net interest income growth as non-interest income is considered a lower-quality and non-recurring revenue source.
Software is eating the world and there is virtually no industry left that has been untouched by it. That drives increasing demand for tools helping software developers do their jobs, whether it be monitoring critical cloud infrastructure, integrating audio and video functionality, or ensuring smooth content streaming. Click here to access a free report on our 3 favorite stocks to play this generational megatrend.
Tangible Book Value Per Share (TBVPS)
Banks operate as balance sheet businesses, with profits generated through borrowing and lending activities. Valuations reflect this reality, emphasizing balance sheet strength and long-term book value compounding ability.
This is why we consider tangible book value per share (TBVPS) the most important metric to track for banks. TBVPS represents the real, liquid net worth per share of a bank, excluding intangible assets that have debatable value upon liquidation. EPS can become murky due to acquisition impacts or accounting flexibility around loan provisions, and TBVPS resists financial engineering manipulation.
Stellar Bancorp’s TBVPS declined at a 3.3% annual clip over the last five years. However, TBVPS growth has accelerated recently, growing by 15.6% annually over the last two years from $15.76 to $21.08 per share.
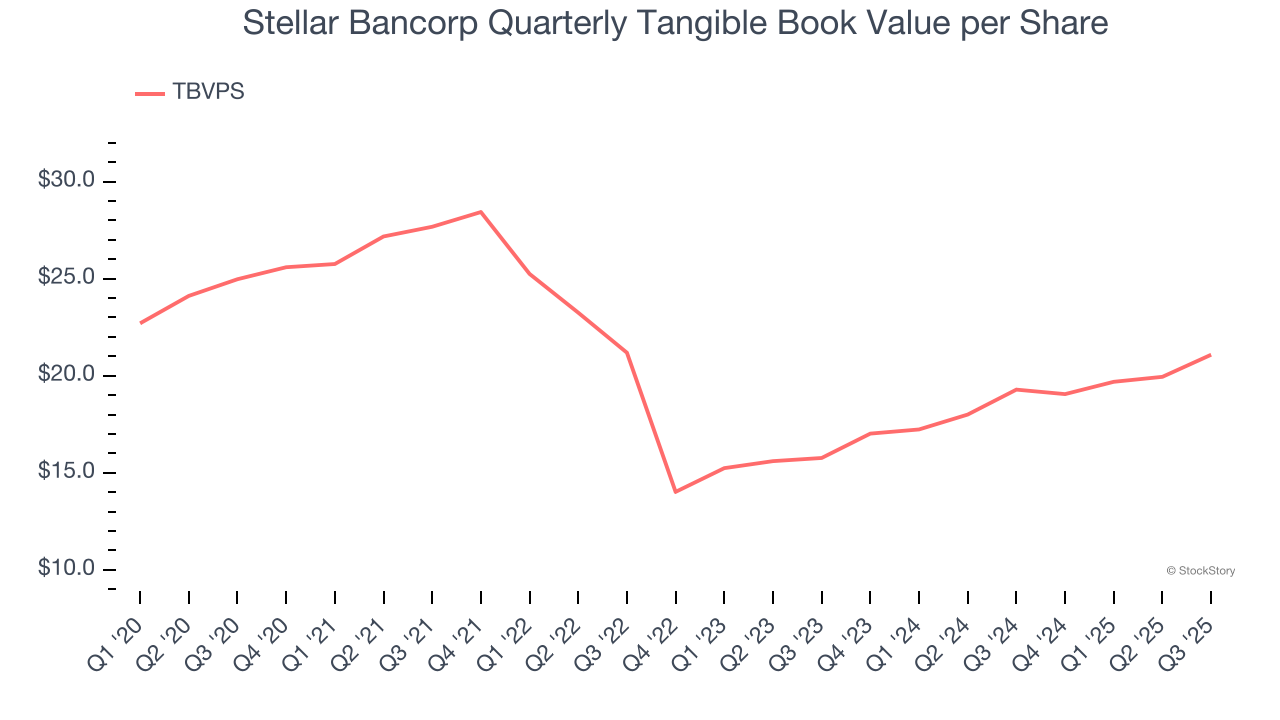
Over the next 12 months, Consensus estimates call for Stellar Bancorp’s TBVPS to grow by 3.9% to $21.91, paltry growth rate.
Key Takeaways from Stellar Bancorp’s Q3 Results
We enjoyed seeing Stellar Bancorp beat analysts’ tangible book value per share expectations this quarter. On the other hand, its EPS was in line and its revenue was in line with Wall Street’s estimates. Overall, this was a quarter without too many surprises. The stock remained flat at $29.65 immediately after reporting.
Should you buy the stock or not? We think that the latest quarter is only one piece of the longer-term business quality puzzle. Quality, when combined with valuation, can help determine if the stock is a buy. We cover that in our actionable full research report which you can read here, it’s free for active Edge members.


