Children’s apparel manufacturer Carter’s (NYSE: CRI) missed Wall Street’s revenue expectations in Q3 CY2025, with sales flat year on year at $757.8 million. Its non-GAAP profit of $0.74 per share was in line with analysts’ consensus estimates.
Is now the time to buy Carter's? Find out by accessing our full research report, it’s free for active Edge members.
Carter's (CRI) Q3 CY2025 Highlights:
- Revenue: $757.8 million vs analyst estimates of $772.4 million (flat year on year, 1.9% miss)
- Adjusted EPS: $0.74 vs analyst estimates of $0.74 (in line)
- Operating Margin: 3.8%, down from 10.2% in the same quarter last year
- Free Cash Flow was -$179 million compared to -$95.69 million in the same quarter last year
- Same-Store Sales rose 2% year on year (-7.1% in the same quarter last year)
- Market Capitalization: $1.18 billion
“Our third quarter performance reflected continued improvement in U.S. Retail business demand as we achieved positive comparable sales and improved pricing for the second consecutive quarter,” said Douglas C. Palladini, Chief Executive Officer & President.
Company Overview
Rumored to sell more than 10 products for every child born in the United States, Carter's (NYSE: CRI) is an American designer and marketer of children's apparel.
Revenue Growth
A company’s long-term performance is an indicator of its overall quality. Any business can put up a good quarter or two, but the best consistently grow over the long haul. Over the last five years, Carter’s demand was weak and its revenue declined by 2% per year. This was below our standards and suggests it’s a low quality business.
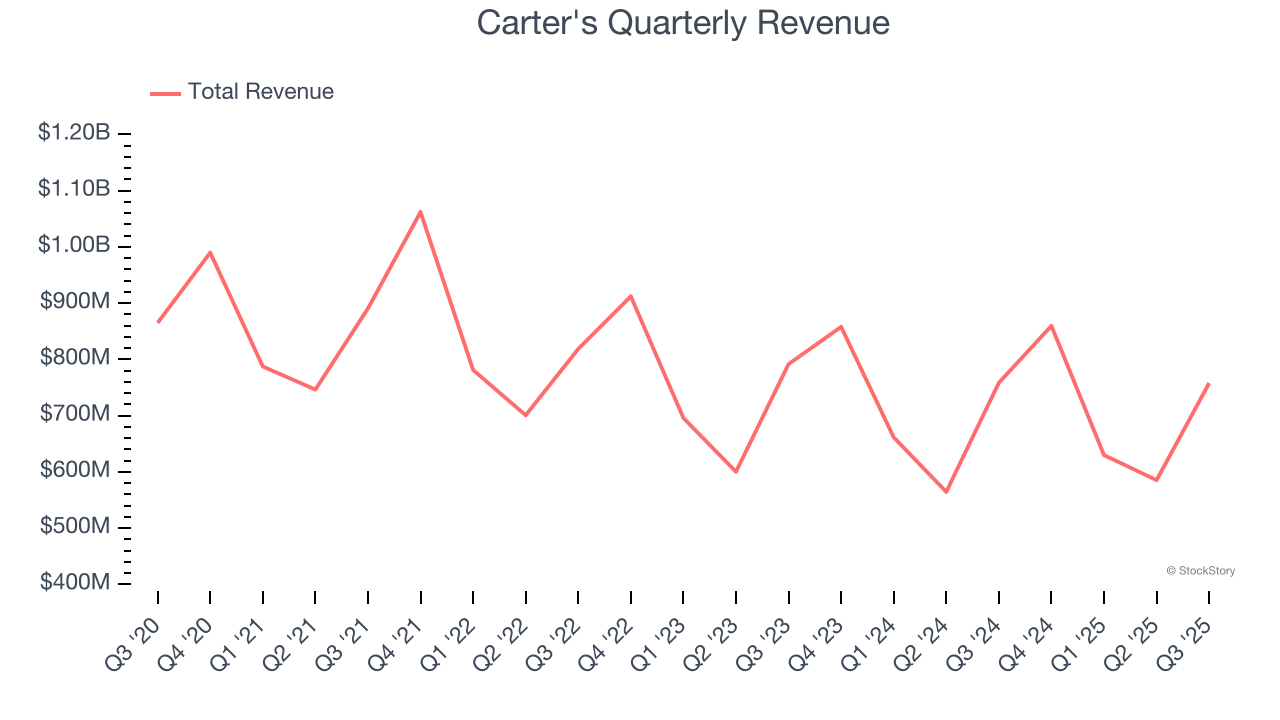
We at StockStory place the most emphasis on long-term growth, but within consumer discretionary, a stretched historical view may miss a company riding a successful new product or trend. Carter’s annualized revenue declines of 2.8% over the last two years align with its five-year trend, suggesting its demand has consistently shrunk. 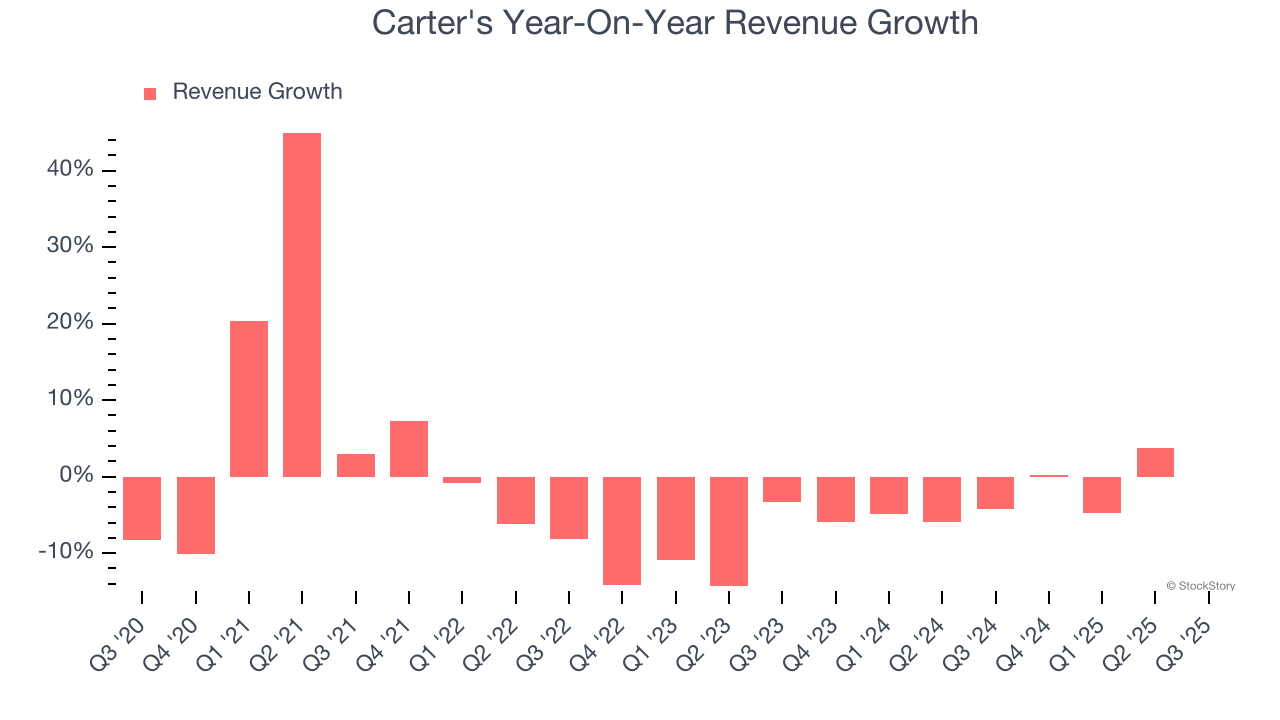
Carter's also reports same-store sales, which show how much revenue its established locations generate. Over the last two years, Carter’s same-store sales averaged 5.1% year-on-year declines. Because this number is lower than its revenue growth, we can see the opening of new locations is boosting the company’s top-line performance. 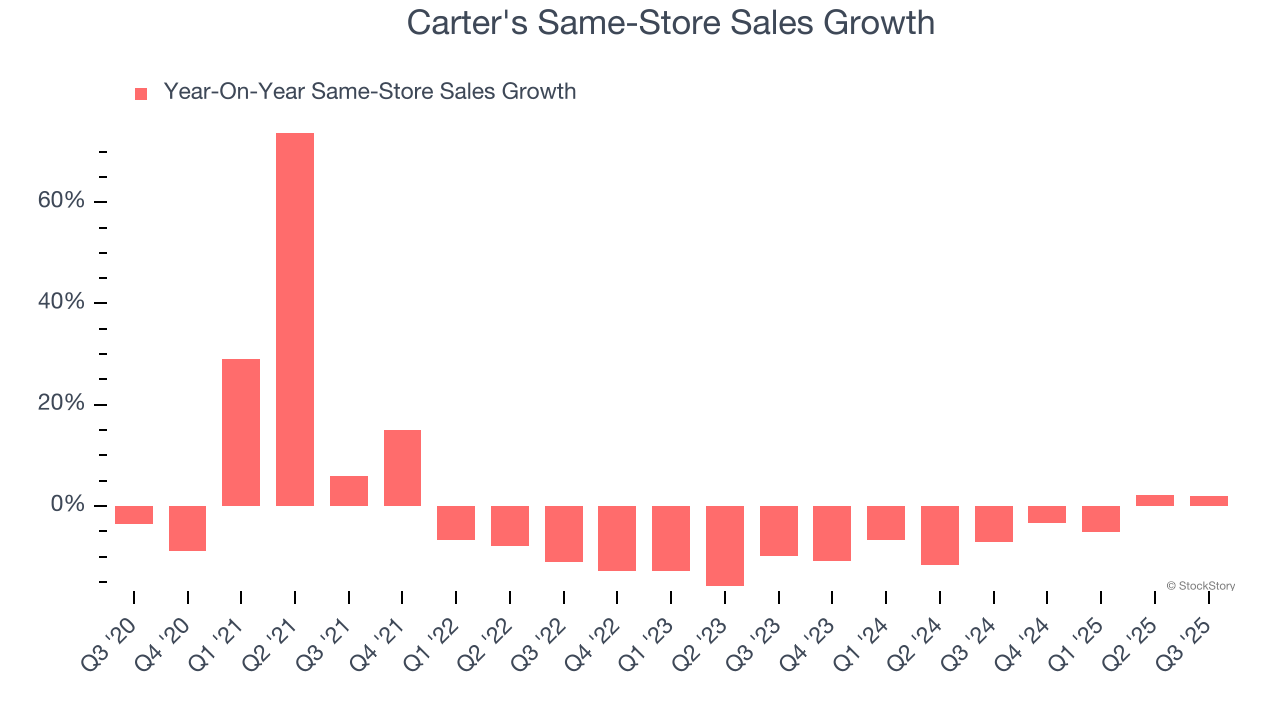
This quarter, Carter's missed Wall Street’s estimates and reported a rather uninspiring 0.1% year-on-year revenue decline, generating $757.8 million of revenue.
Looking ahead, sell-side analysts expect revenue to grow 1% over the next 12 months. While this projection suggests its newer products and services will spur better top-line performance, it is still below average for the sector.
Unless you’ve been living under a rock, it should be obvious by now that generative AI is going to have a huge impact on how large corporations do business. While Nvidia and AMD are trading close to all-time highs, we prefer a lesser-known (but still profitable) stock benefiting from the rise of AI. Click here to access our free report one of our favorites growth stories.
Operating Margin
Carter’s operating margin has been trending down over the last 12 months and averaged 7.9% over the last two years. The company’s profitability was mediocre for a consumer discretionary business and shows it couldn’t pass its higher operating expenses onto its customers.
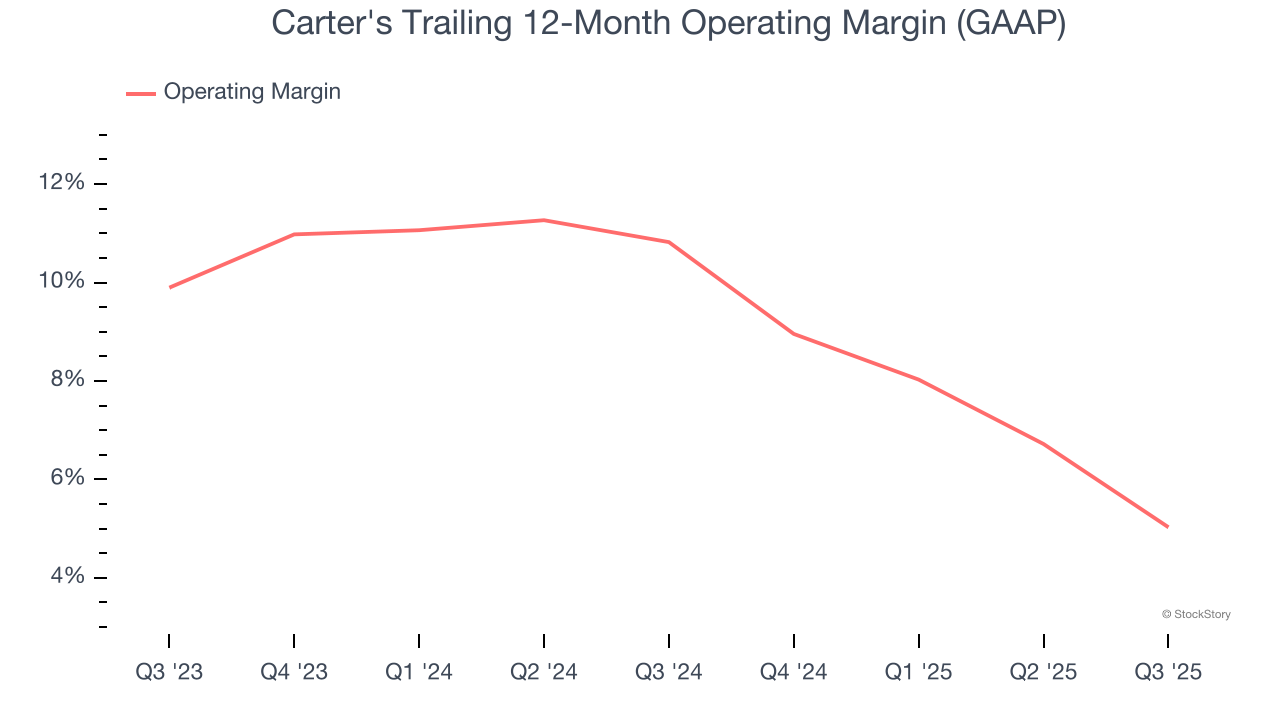
This quarter, Carter's generated an operating margin profit margin of 3.8%, down 6.3 percentage points year on year. This contraction shows it was less efficient because its expenses increased relative to its revenue.
Earnings Per Share
Revenue trends explain a company’s historical growth, but the long-term change in earnings per share (EPS) points to the profitability of that growth – for example, a company could inflate its sales through excessive spending on advertising and promotions.
Sadly for Carter's, its EPS and revenue declined by 2.5% and 2% annually over the last five years. We tend to steer our readers away from companies with falling revenue and EPS, where diminishing earnings could imply changing secular trends and preferences. Consumer Discretionary companies are particularly exposed to this, and if the tide turns unexpectedly, Carter’s low margin of safety could leave its stock price susceptible to large downswings.
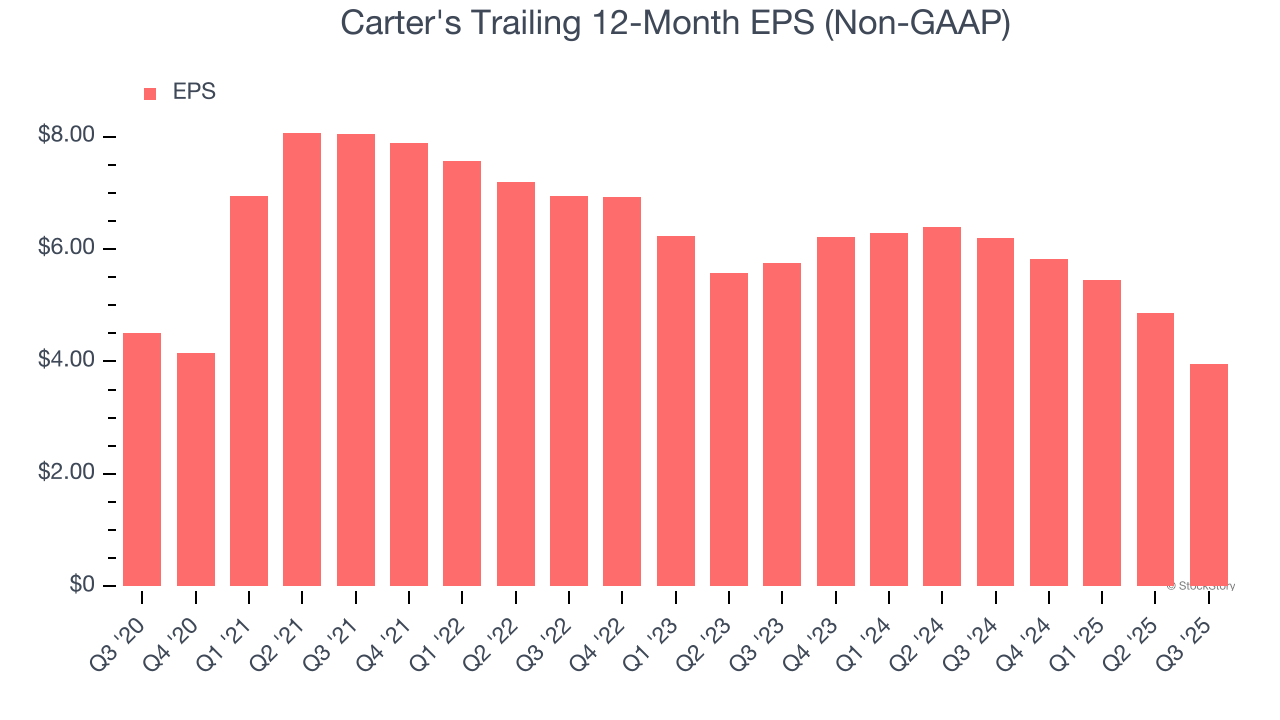
In Q3, Carter's reported adjusted EPS of $0.74, down from $1.64 in the same quarter last year. This print was close to analysts’ estimates. Over the next 12 months, Wall Street expects Carter’s full-year EPS of $3.96 to shrink by 43.3%.
Key Takeaways from Carter’s Q3 Results
Same-store sales narrowly outperformed Wall Street’s estimates, but revenue missed. Operating margin was also down year on year. Zooming out, we think this quarter could have been better. The stock traded down 10.4% to $29 immediately following the results.
Is Carter's an attractive investment opportunity at the current price? What happened in the latest quarter matters, but not as much as longer-term business quality and valuation, when deciding whether to invest in this stock. We cover that in our actionable full research report which you can read here, it’s free for active Edge members.