Packaged snacks company Mondelez (NASDAQ: MDLZ) met Wall Street’s revenue expectations in Q3 CY2025, with sales up 5.9% year on year to $9.74 billion. Its non-GAAP profit of $0.73 per share was 2.9% above analysts’ consensus estimates.
Is now the time to buy Mondelez? Find out by accessing our full research report, it’s free for active Edge members.
Mondelez (MDLZ) Q3 CY2025 Highlights:
- Revenue: $9.74 billion vs analyst estimates of $9.71 billion (5.9% year-on-year growth, in line)
- Adjusted EPS: $0.73 vs analyst estimates of $0.71 (2.9% beat)
- Adjusted EBITDA: $712 million vs analyst estimates of $1.62 billion (7.3% margin, 56.2% miss)
- Operating Margin: 7.6%, down from 12.5% in the same quarter last year
- Free Cash Flow Margin: 4.3%, down from 10.7% in the same quarter last year
- Organic Revenue rose 3.4% year on year vs analyst estimates of 3.7% growth (31.4 basis point miss)
- Sales Volumes fell 4.6% year on year (0.3% in the same quarter last year)
- Market Capitalization: $79.78 billion
Company Overview
Founded as Nabisco in 1903, Mondelez (NASDAQ: MDLZ) is a packaged snacks powerhouse best known for its Oreo, Cadbury, Toblerone, Ritz, and Trident brands.
Revenue Growth
A company’s long-term performance is an indicator of its overall quality. Even a bad business can shine for one or two quarters, but a top-tier one grows for years.
With $37.65 billion in revenue over the past 12 months, Mondelez is one of the most widely recognized consumer staples companies. Its influence over consumers gives it negotiating leverage with distributors, enabling it to pick and choose where it sells its products (a luxury many don’t have).
As you can see below, Mondelez grew its sales at a decent 7.3% compounded annual growth rate over the last three years despite consumers buying less of its products. We’ll explore what this means in the "Volume Growth" section.
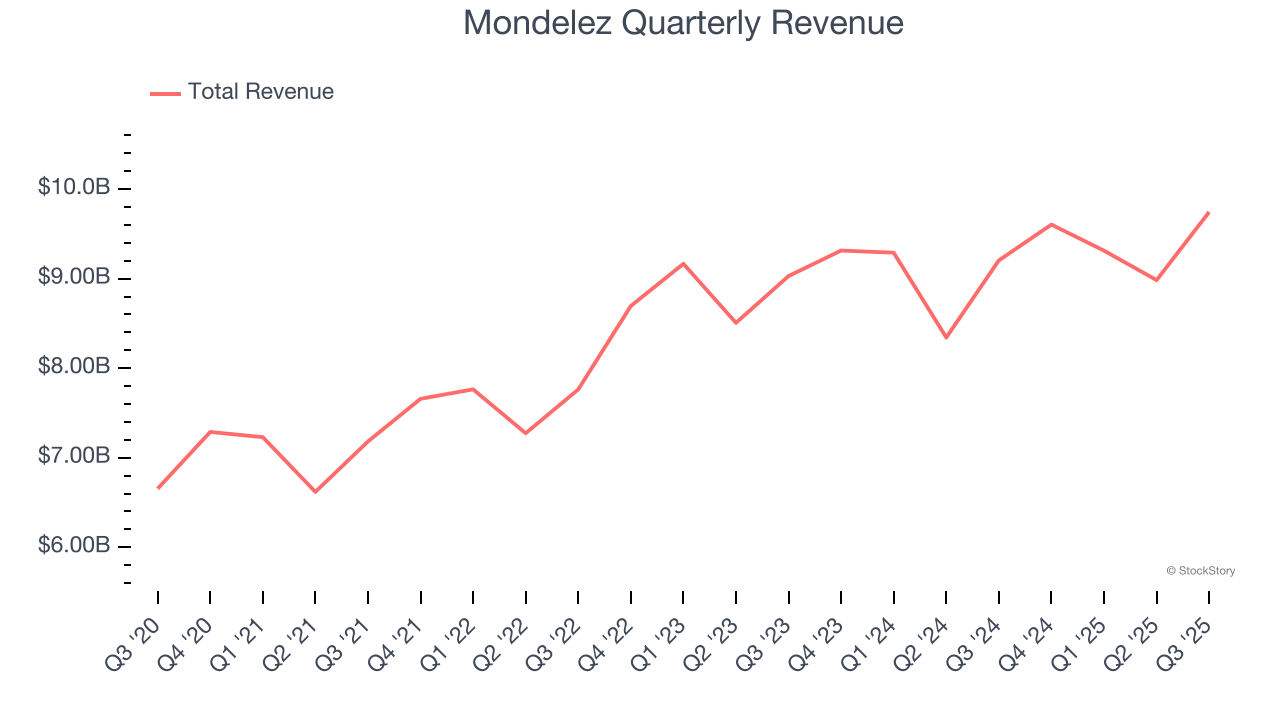
This quarter, Mondelez grew its revenue by 5.9% year on year, and its $9.74 billion of revenue was in line with Wall Street’s estimates.
Looking ahead, sell-side analysts expect revenue to grow 5.9% over the next 12 months, similar to its three-year rate. We still think its growth trajectory is satisfactory given its scale and suggests the market sees success for its products.
Software is eating the world and there is virtually no industry left that has been untouched by it. That drives increasing demand for tools helping software developers do their jobs, whether it be monitoring critical cloud infrastructure, integrating audio and video functionality, or ensuring smooth content streaming. Click here to access a free report on our 3 favorite stocks to play this generational megatrend.
Volume Growth
Revenue growth can be broken down into changes in price and volume (the number of units sold). While both are important, volume is the lifeblood of a successful staples business as there’s a ceiling to what consumers will pay for everyday goods; they can always trade down to non-branded products if the branded versions are too expensive.
To analyze whether Mondelez generated its growth from changes in price or volume, we can compare its volume growth to its organic revenue growth, which excludes non-fundamental impacts on company financials like mergers and currency fluctuations.
Over the last two years, Mondelez’s average quarterly sales volumes have shrunk by 1.2%. This decrease isn’t ideal as the quantity demanded for consumer staples products is typically stable. Luckily, Mondelez was able to offset fewer customers purchasing its products by charging higher prices, enabling it to generate 4.9% average organic revenue growth. We hope the company can grow its volumes soon, however, as consistent price increases (on top of inflation) aren’t sustainable over the long term unless the business is really really special.
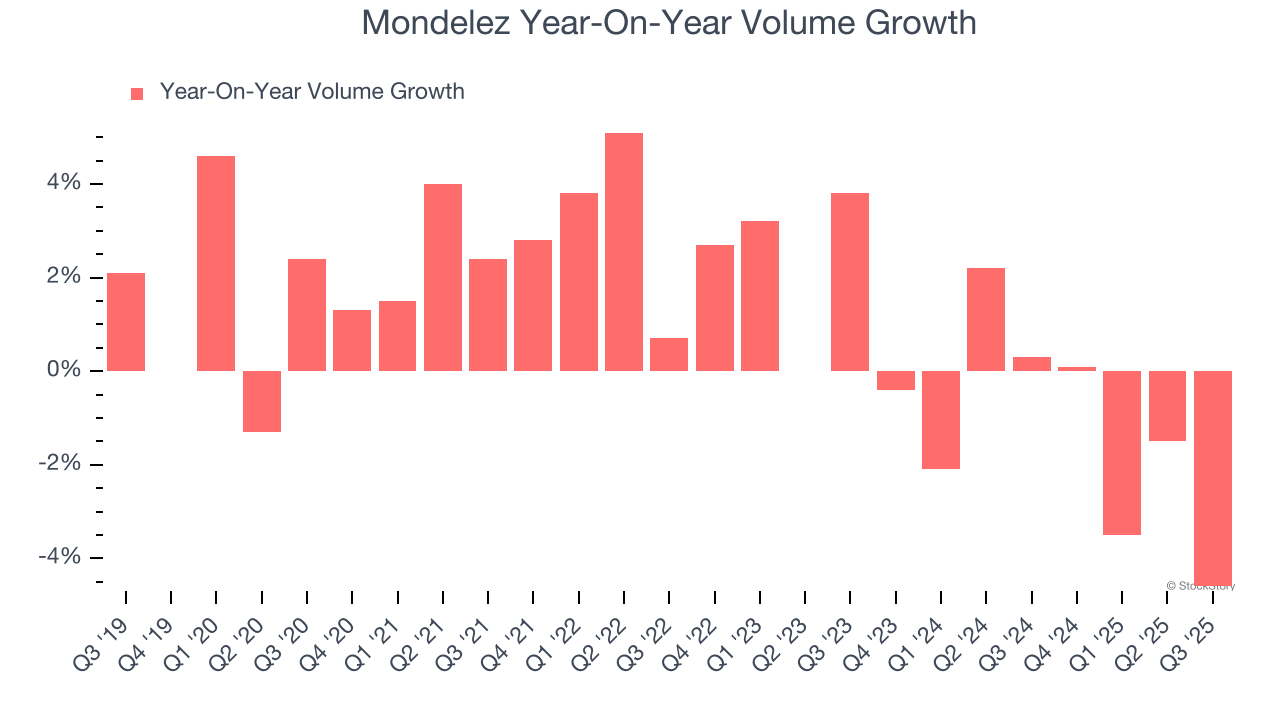
In Mondelez’s Q3 2025, sales volumes dropped 4.6% year on year. This result represents a further deceleration from its historical levels, showing the business is struggling to move its products.
Key Takeaways from Mondelez’s Q3 Results
We struggled to find many positives in these results. Although its EPS beat, its EBITDA and gross margin fell short of Wall Street’s estimates due to "record-high cocoa cost inflation". Cocoa costs have been a persistent issue over the past year. Overall, this was a weaker quarter. The stock traded down 4.5% to $57.50 immediately following the results.
Mondelez may have had a tough quarter, but does that actually create an opportunity to invest right now? When making that decision, it’s important to consider its valuation, business qualities, as well as what has happened in the latest quarter. We cover that in our actionable full research report which you can read here, it’s free for active Edge members.