
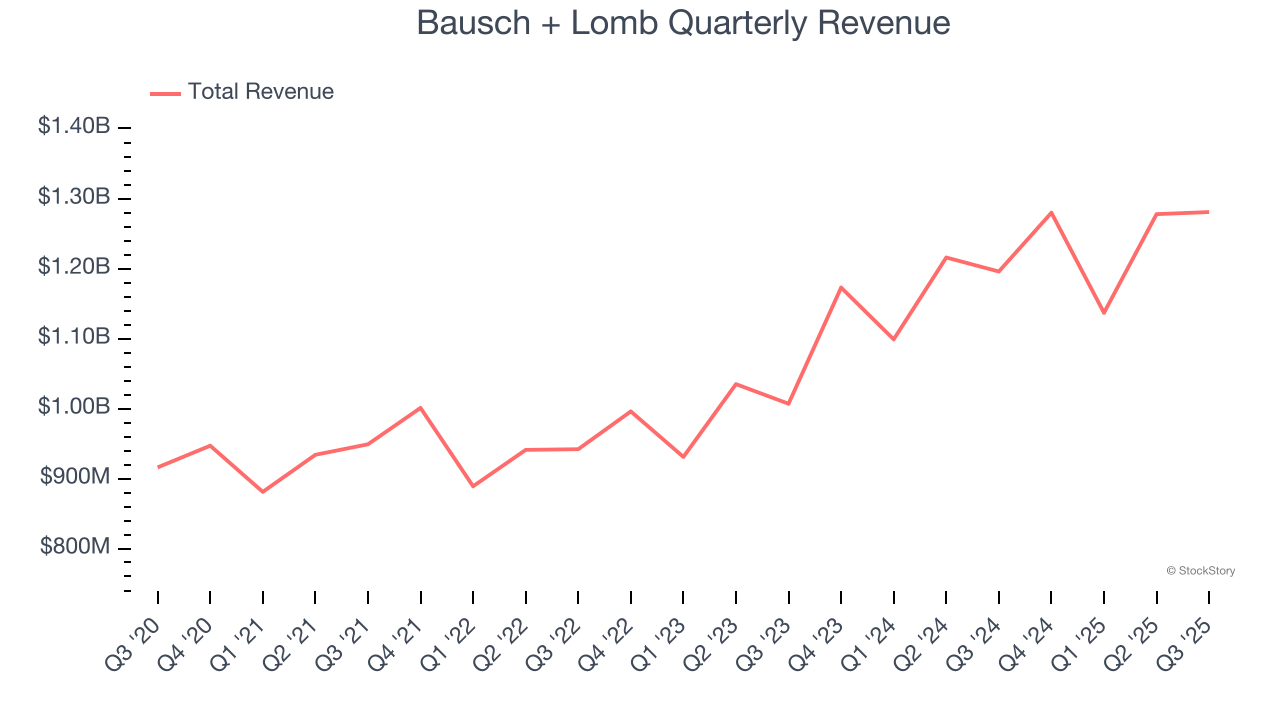
Eyecare company Bausch + Lomb (NYSE: BLCO) met Wall Streets revenue expectations in Q3 CY2025, with sales up 7.1% year on year to $1.28 billion. The company’s outlook for the full year was close to analysts’ estimates with revenue guided to $5.1 billion at the midpoint. Its non-GAAP profit of $0.18 per share was 11.9% above analysts’ consensus estimates.
Is now the time to buy Bausch + Lomb? Find out by accessing our full research report, it’s free for active Edge members.
Bausch + Lomb (BLCO) Q3 CY2025 Highlights:
- Revenue: $1.28 billion vs analyst estimates of $1.28 billion (7.1% year-on-year growth, in line)
- Adjusted EPS: $0.18 vs analyst estimates of $0.16 (11.9% beat)
- Adjusted EBITDA: $243 million vs analyst estimates of $231.8 million (19% margin, 4.8% beat)
- The company reconfirmed its revenue guidance for the full year of $5.1 billion at the midpoint
- EBITDA guidance for the full year is $890 million at the midpoint, above analyst estimates of $872.5 million
- Operating Margin: 7.4%, up from 3.6% in the same quarter last year
- Constant Currency Revenue rose 6% year on year (19.3% in the same quarter last year)
- Market Capitalization: $5.38 billion
“We’re delivering on the vision we laid out in 2023, with a base business engine that continues to hum and steady introduction of innovative products across categories,” said Brent Saunders, chairman and CEO, Bausch + Lomb.
Company Overview
With a nearly 170-year history dedicated to vision care and eye health innovation, Bausch + Lomb (NYSE: BLCO) develops and manufactures a comprehensive range of eye health products including contact lenses, pharmaceuticals, surgical devices, and consumer eye care solutions.
Revenue Growth
A company’s long-term performance is an indicator of its overall quality. Any business can put up a good quarter or two, but the best consistently grow over the long haul. Over the last five years, Bausch + Lomb grew its sales at a decent 7.7% compounded annual growth rate. Its growth was slightly above the average healthcare company and shows its offerings resonate with customers.
We at StockStory place the most emphasis on long-term growth, but within healthcare, a half-decade historical view may miss recent innovations or disruptive industry trends. Bausch + Lomb’s annualized revenue growth of 12% over the last two years is above its five-year trend, suggesting some bright spots. 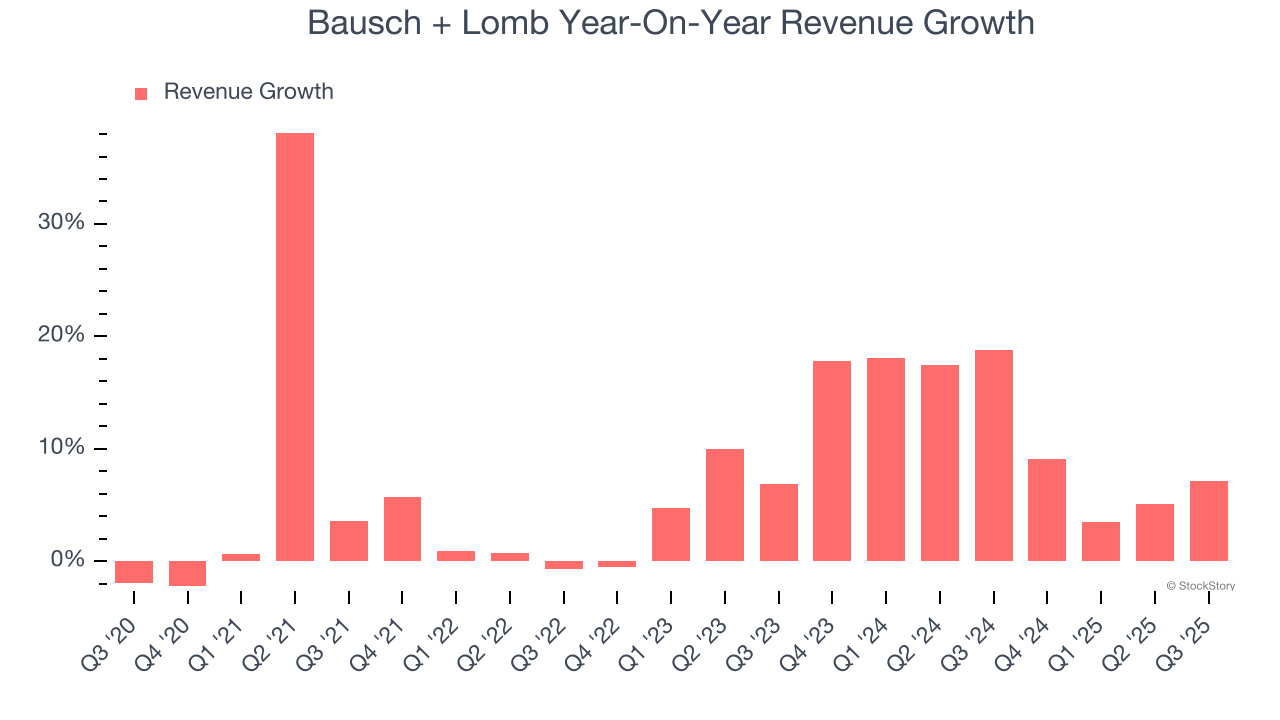
We can dig further into the company’s sales dynamics by analyzing its constant currency revenue, which excludes currency movements that are outside their control and not indicative of demand. Over the last two years, its constant currency sales averaged 13% year-on-year growth. Because this number aligns with its normal revenue growth, we can see that Bausch + Lomb has properly hedged its foreign currency exposure. 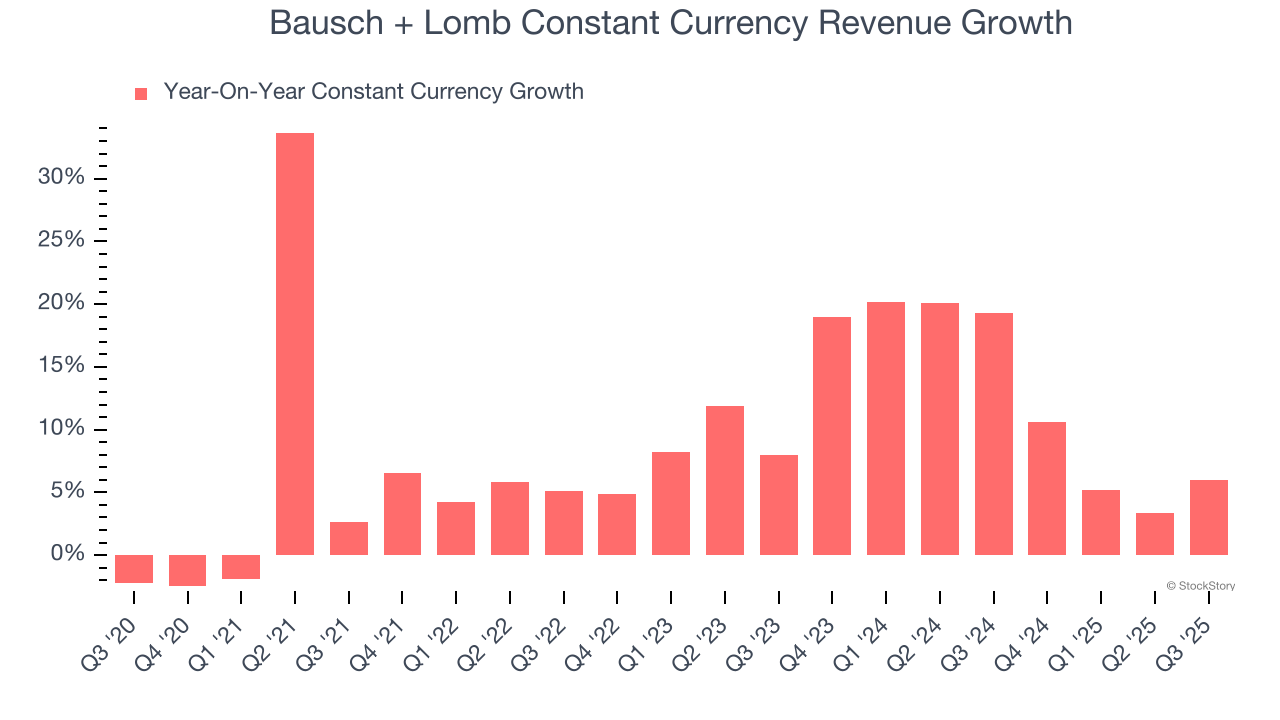
This quarter, Bausch + Lomb grew its revenue by 7.1% year on year, and its $1.28 billion of revenue was in line with Wall Street’s estimates.
Looking ahead, sell-side analysts expect revenue to grow 6.8% over the next 12 months, a deceleration versus the last two years. Still, this projection is above average for the sector and indicates the market sees some success for its newer products and services.
Here at StockStory, we certainly understand the potential of thematic investing. Diverse winners from Microsoft (MSFT) to Alphabet (GOOG), Coca-Cola (KO) to Monster Beverage (MNST) could all have been identified as promising growth stories with a megatrend driving the growth. So, in that spirit, we’ve identified a relatively under-the-radar profitable growth stock benefiting from the rise of AI, available to you FREE via this link.
Operating Margin
Bausch + Lomb was profitable over the last five years but held back by its large cost base. Its average operating margin of 4.4% was weak for a healthcare business.
Analyzing the trend in its profitability, Bausch + Lomb’s operating margin decreased by 7.2 percentage points over the last five years. The company’s two-year trajectory also shows it failed to get its profitability back to the peak as its margin fell by 1.6 percentage points. This performance was poor no matter how you look at it - it shows its expenses were rising and it couldn’t pass those costs onto its customers.
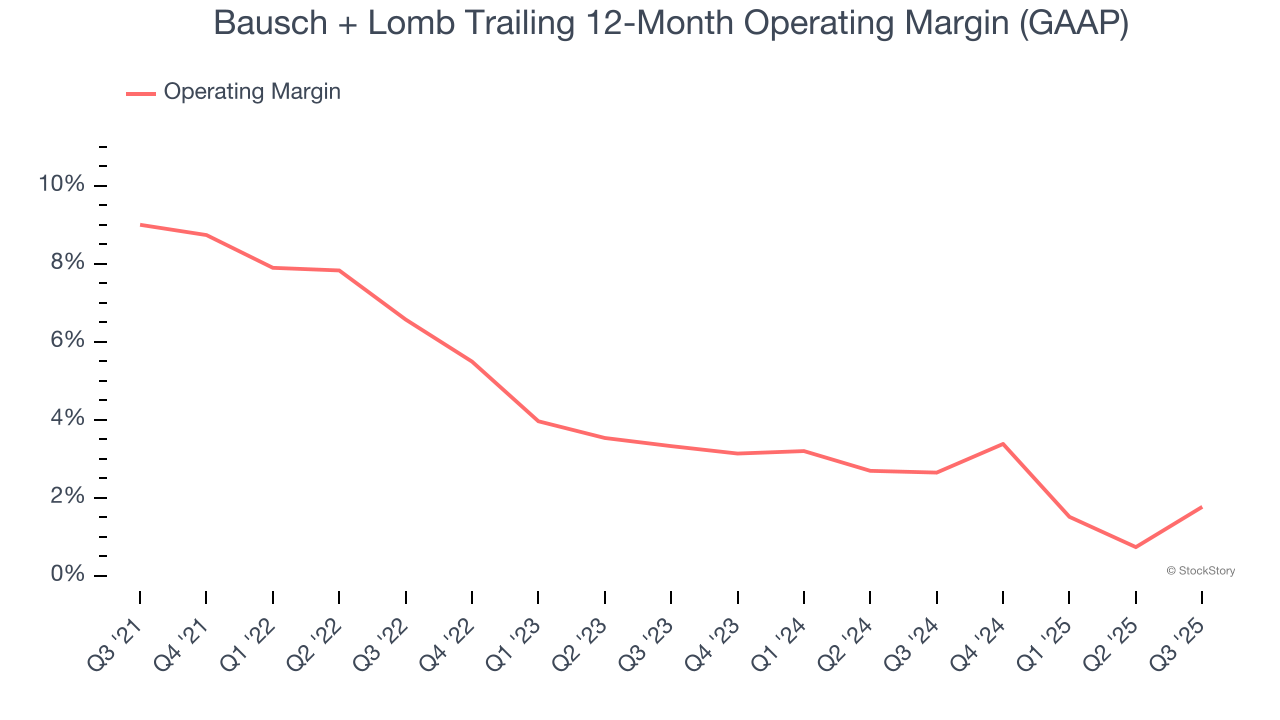
This quarter, Bausch + Lomb generated an operating margin profit margin of 7.4%, up 3.8 percentage points year on year. This increase was a welcome development and shows it was more efficient.
Earnings Per Share
We track the long-term change in earnings per share (EPS) for the same reason as long-term revenue growth. Compared to revenue, however, EPS highlights whether a company’s growth is profitable.
Sadly for Bausch + Lomb, its EPS declined by 20.4% annually over the last five years while its revenue grew by 7.7%. This tells us the company became less profitable on a per-share basis as it expanded.
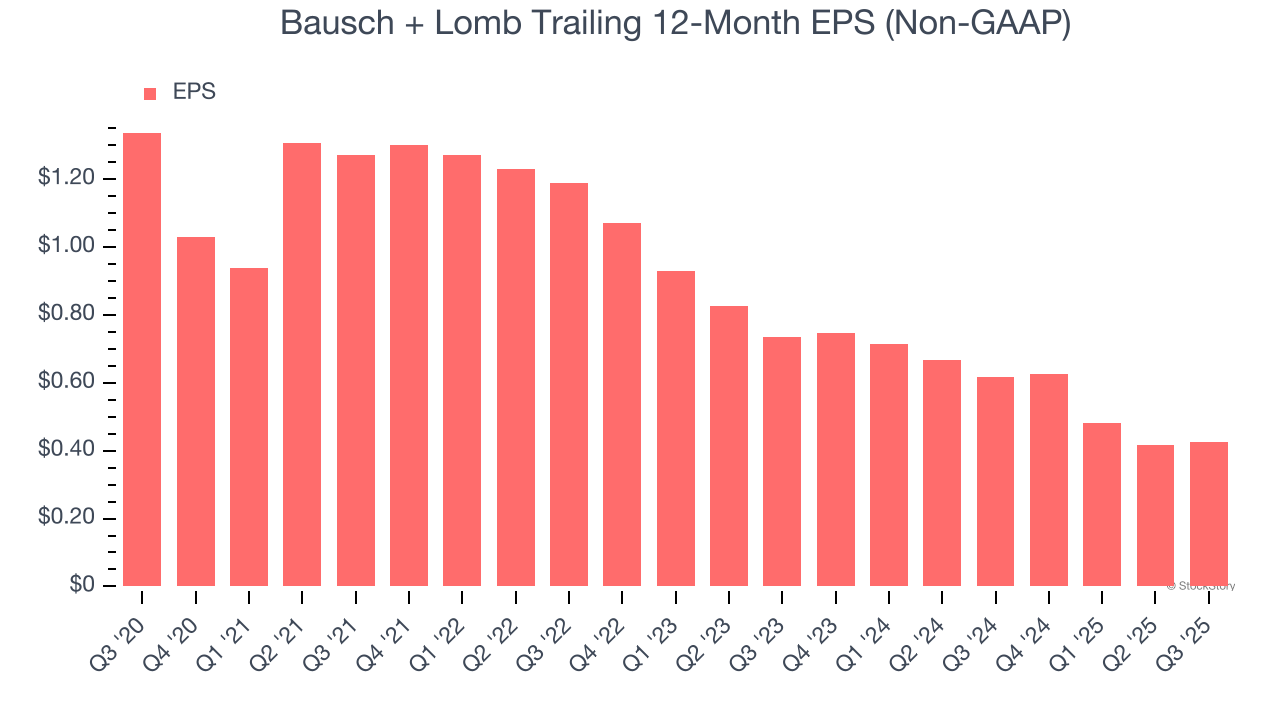
We can take a deeper look into Bausch + Lomb’s earnings to better understand the drivers of its performance. As we mentioned earlier, Bausch + Lomb’s operating margin expanded this quarter but declined by 7.2 percentage points over the last five years. This was the most relevant factor (aside from the revenue impact) behind its lower earnings; interest expenses and taxes can also affect EPS but don’t tell us as much about a company’s fundamentals.
In Q3, Bausch + Lomb reported adjusted EPS of $0.18, in line with the same quarter last year. This print easily cleared analysts’ estimates, and shareholders should be content with the results. Over the next 12 months, Wall Street expects Bausch + Lomb’s full-year EPS of $0.43 to grow 97.2%.
Key Takeaways from Bausch + Lomb’s Q3 Results
It was good to see Bausch + Lomb beat analysts’ EPS expectations this quarter. We were also glad its full-year EBITDA guidance exceeded Wall Street’s estimates. Overall, this print had some key positives. The stock traded up 8.6% to $16.49 immediately following the results.
Is Bausch + Lomb an attractive investment opportunity right now? What happened in the latest quarter matters, but not as much as longer-term business quality and valuation, when deciding whether to invest in this stock. We cover that in our actionable full research report which you can read here, it’s free for active Edge members.


