
Student loan servicer Navient (NASDAQ: NAVI) missed Wall Street’s revenue expectations in Q3 CY2025, with sales falling 64.4% year on year to $161 million. Its GAAP loss of $0.87 per share was significantly below analysts’ consensus estimates.
Is now the time to buy Navient? Find out by accessing our full research report, it’s free for active Edge members.
Navient (NAVI) Q3 CY2025 Highlights:
- Net Interest Income: $142 million vs analyst estimates of $143 million (0.7% miss)
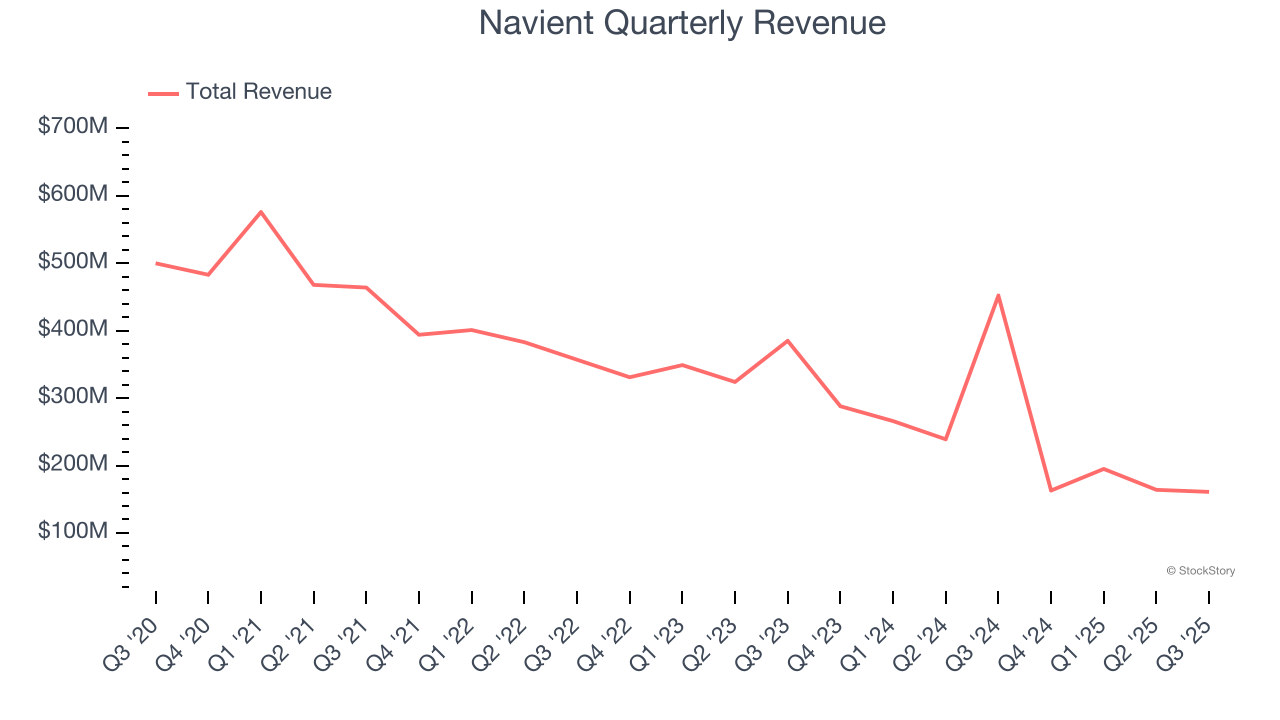
- Revenue: $161 million vs analyst estimates of $162.8 million (64.4% year-on-year decline, 1.1% miss)
- Pre-tax Profit: -$117 million (-72.7% margin, 1,075% year-on-year decline)
- EPS (GAAP): -$0.87 vs analyst estimates of $0.17 (significant miss)
- Market Capitalization: $1.29 billion
Company Overview
Spun off from Sallie Mae in 2014 to handle the company's loan servicing and collection operations, Navient (NASDAQ: NAVI) provides education loan servicing and business processing solutions that help manage federal student loans, private education loans, and government services.
Revenue Growth
Reviewing a company’s long-term sales performance reveals insights into its quality. Any business can have short-term success, but a top-tier one grows for years. Navient struggled to consistently generate demand over the last five years as its revenue dropped at a 18.9% annual rate. This was below our standards and suggests it’s a low quality business.
We at StockStory place the most emphasis on long-term growth, but within financials, a half-decade historical view may miss recent interest rate changes, market returns, and industry trends. Navient’s recent performance shows its demand remained suppressed as its revenue has declined by 29.9% annually over the last two years. 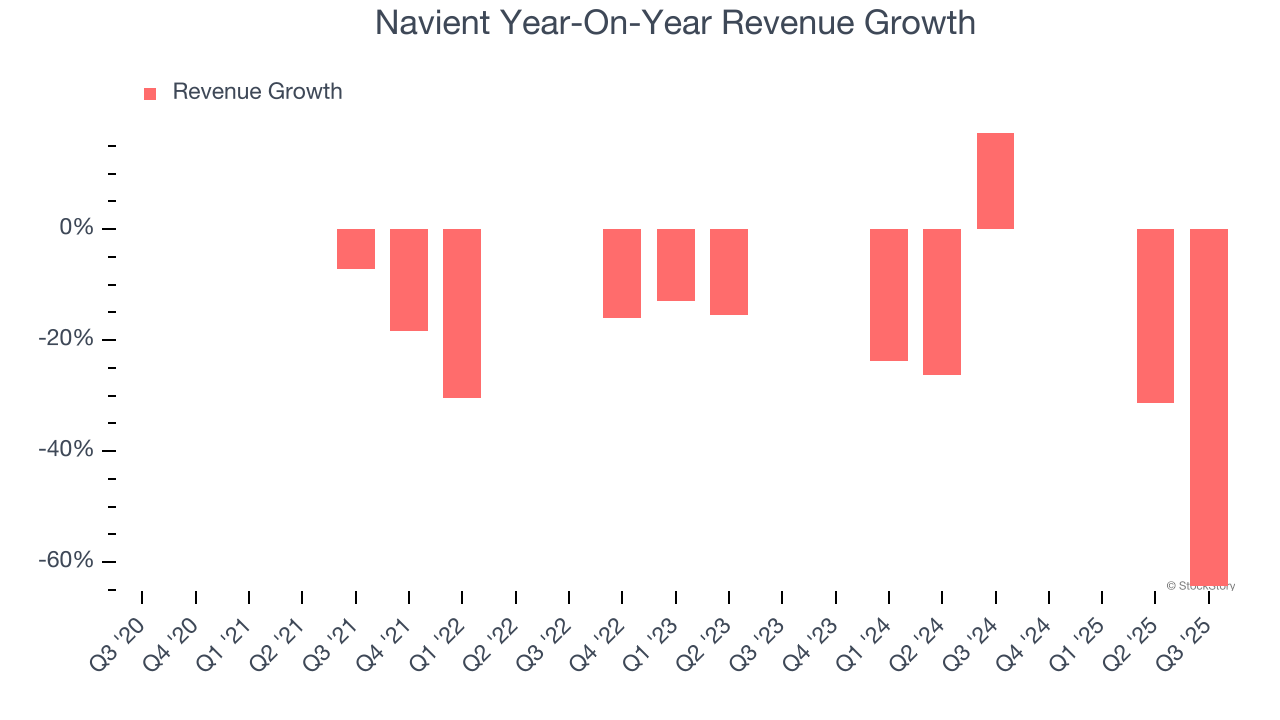 Note: Quarters not shown were determined to be outliers, impacted by outsized investment gains/losses that are not indicative of the recurring fundamentals of the business.
This quarter, Navient missed Wall Street’s estimates and reported a rather uninspiring 64.4% year-on-year revenue decline, generating $161 million of revenue.
Today’s young investors won’t have read the timeless lessons in Gorilla Game: Picking Winners In High Technology because it was written more than 20 years ago when Microsoft and Apple were first establishing their supremacy. But if we apply the same principles, then enterprise software stocks leveraging their own generative AI capabilities may well be the Gorillas of the future. So, in that spirit, we are excited to present our Special Free Report on a profitable, fast-growing enterprise software stock that is already riding the automation wave and looking to catch the generative AI next.
Key Takeaways from Navient’s Q3 Results
We struggled to find many positives in these results. Its EPS missed and its net interest income fell slightly short of Wall Street’s estimates. Overall, this was a weaker quarter. The stock traded down 4.6% to $12.35 immediately following the results.
Navient didn’t show it’s best hand this quarter, but does that create an opportunity to buy the stock right now? What happened in the latest quarter matters, but not as much as longer-term business quality and valuation, when deciding whether to invest in this stock. We cover that in our actionable full research report which you can read here, it’s free for active Edge members.