
Specialty vehicles contractor Oshkosh (NYSE: OSK) fell short of the markets revenue expectations in Q3 CY2025, with sales falling 1.9% year on year to $2.69 billion. The company’s full-year revenue guidance of $10.35 billion at the midpoint came in 2% below analysts’ estimates. Its non-GAAP profit of $3.20 per share was 3.3% above analysts’ consensus estimates.
Is now the time to buy Oshkosh? Find out by accessing our full research report, it’s free for active Edge members.
Oshkosh (OSK) Q3 CY2025 Highlights:
- Revenue: $2.69 billion vs analyst estimates of $2.85 billion (1.9% year-on-year decline, 5.8% miss)
- Adjusted EPS: $3.20 vs analyst estimates of $3.10 (3.3% beat)
- Adjusted EBITDA: $274.3 million vs analyst estimates of $347.1 million (10.2% margin, 21% miss)
- The company dropped its revenue guidance for the full year to $10.35 billion at the midpoint from $10.6 billion, a 2.4% decrease
- Management lowered its full-year Adjusted EPS guidance to $10.75 at the midpoint, a 2.3% decrease
- Operating Margin: 9.7%, in line with the same quarter last year
- Free Cash Flow Margin: 17.3%, up from 9.9% in the same quarter last year
- Backlog: $13.69 billion at quarter end, down 4% year on year
- Market Capitalization: $8.80 billion
“Oshkosh delivered solid third quarter results in a difficult environment, with adjusted earnings per share of $3.20 and an adjusted operating margin of 10.2 percent,” said John Pfeifer, president and chief executive officer of Oshkosh Corporation.
Company Overview
Oshkosh (NYSE: OSK) manufactures specialty vehicles for the defense, fire, emergency, and commercial industry, operating various brand subsidiaries within each industry.
Revenue Growth
Reviewing a company’s long-term sales performance reveals insights into its quality. Any business can experience short-term success, but top-performing ones enjoy sustained growth for years. Luckily, Oshkosh’s sales grew at a decent 8.6% compounded annual growth rate over the last five years. Its growth was slightly above the average industrials company and shows its offerings resonate with customers.
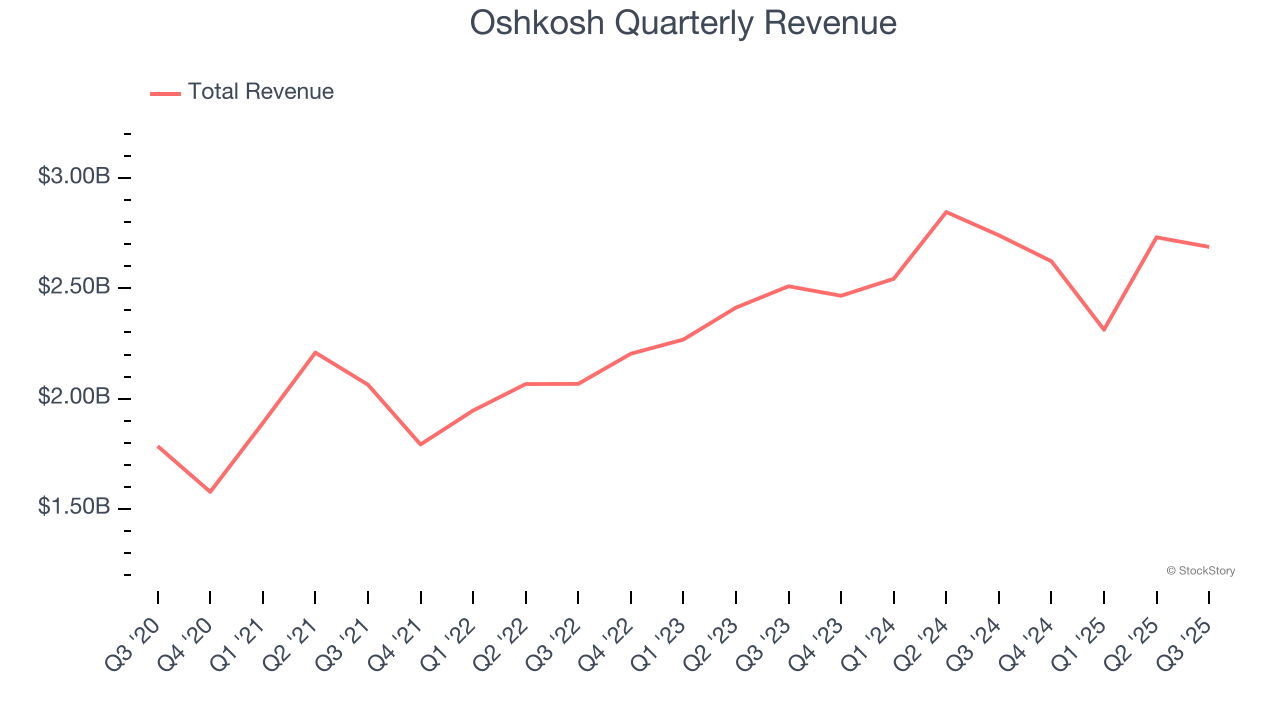
Long-term growth is the most important, but within industrials, a half-decade historical view may miss new industry trends or demand cycles. Oshkosh’s recent performance shows its demand has slowed as its annualized revenue growth of 5% over the last two years was below its five-year trend. We also note many other Heavy Transportation Equipment businesses have faced declining sales because of cyclical headwinds. While Oshkosh grew slower than we’d like, it did do better than its peers. 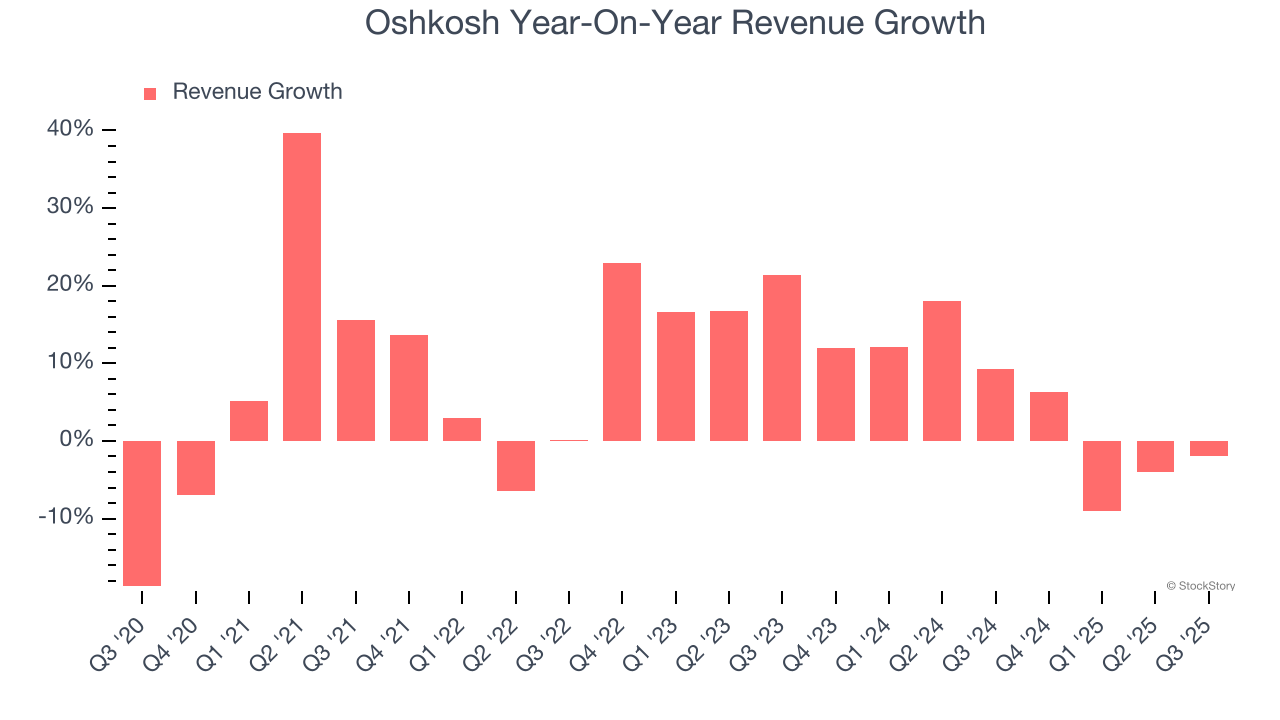
We can better understand the company’s revenue dynamics by analyzing its backlog, or the value of its outstanding orders that have not yet been executed or delivered. Oshkosh’s backlog reached $13.69 billion in the latest quarter and averaged 1.9% year-on-year declines over the last two years. Because this number is lower than its revenue growth, we can see the company hasn’t secured enough new orders to maintain its growth rate in the future. 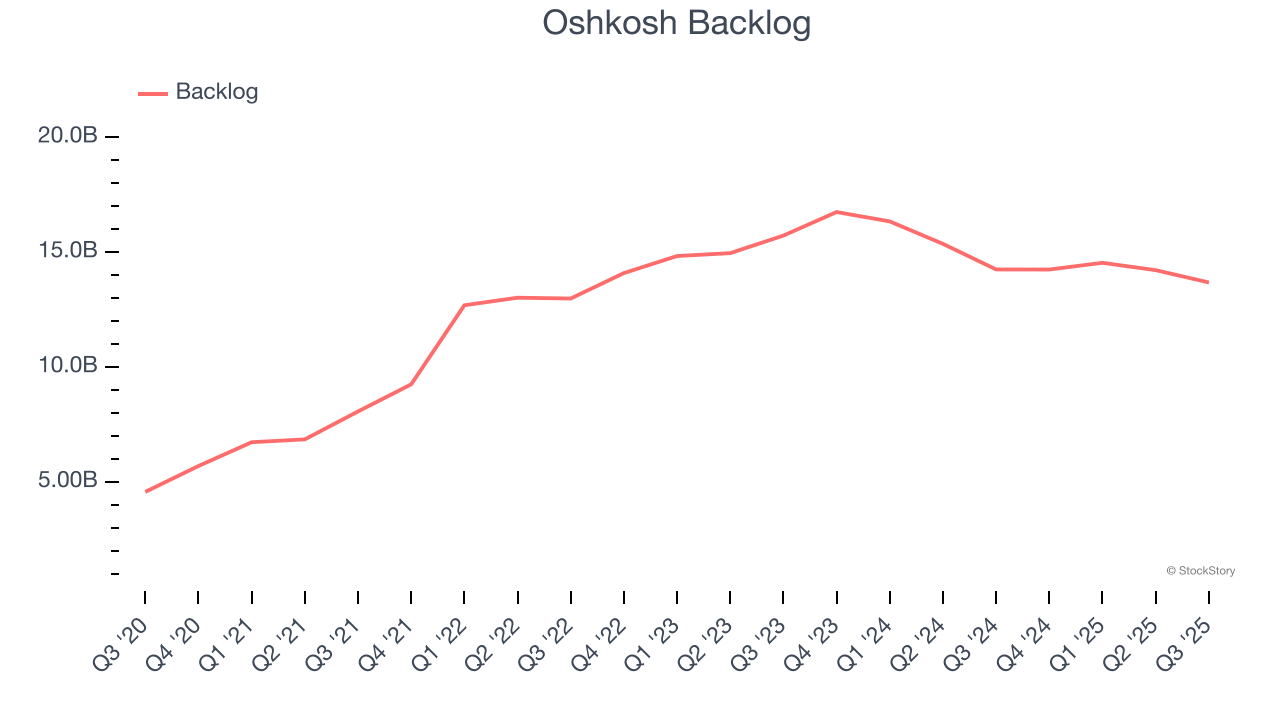
This quarter, Oshkosh missed Wall Street’s estimates and reported a rather uninspiring 1.9% year-on-year revenue decline, generating $2.69 billion of revenue.
Looking ahead, sell-side analysts expect revenue to grow 6.7% over the next 12 months. Although this projection suggests its newer products and services will catalyze better top-line performance, it is still below the sector average.
Here at StockStory, we certainly understand the potential of thematic investing. Diverse winners from Microsoft (MSFT) to Alphabet (GOOG), Coca-Cola (KO) to Monster Beverage (MNST) could all have been identified as promising growth stories with a megatrend driving the growth. So, in that spirit, we’ve identified a relatively under-the-radar profitable growth stock benefiting from the rise of AI, available to you FREE via this link.
Operating Margin
Oshkosh was profitable over the last five years but held back by its large cost base. Its average operating margin of 7.8% was weak for an industrials business. This result isn’t too surprising given its low gross margin as a starting point.
On the plus side, Oshkosh’s operating margin rose by 1.8 percentage points over the last five years, as its sales growth gave it operating leverage.
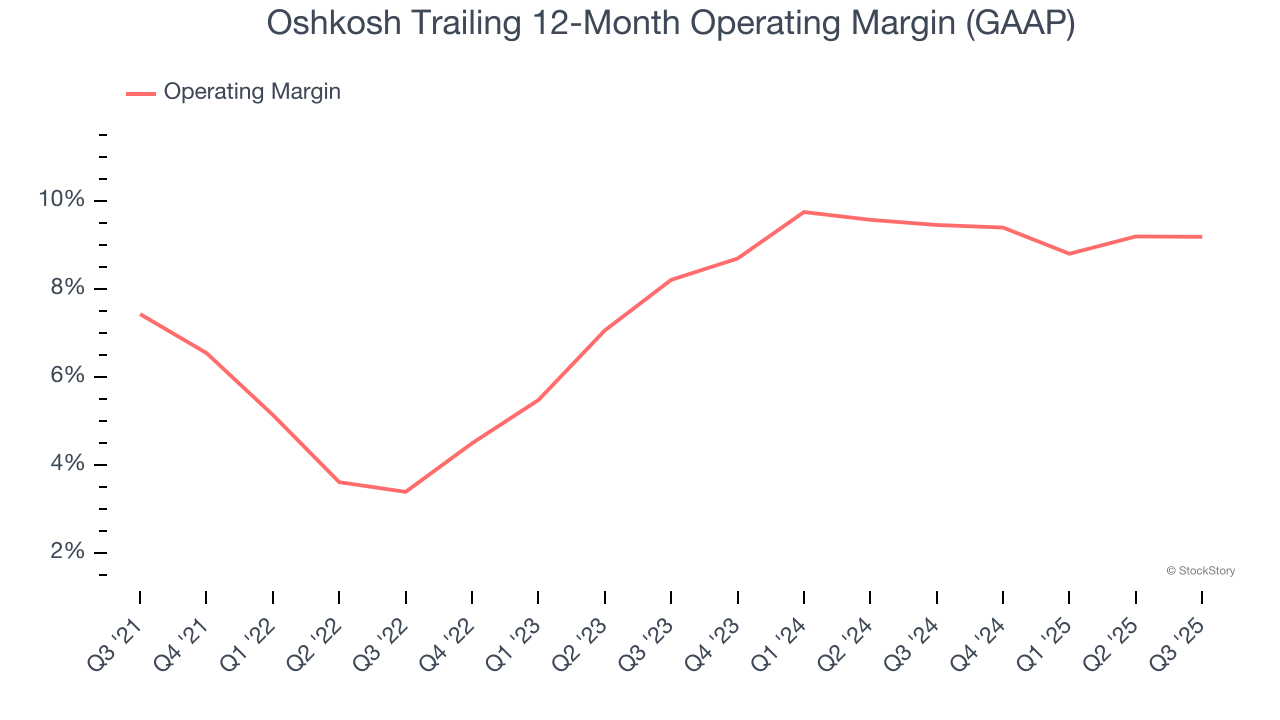
In Q3, Oshkosh generated an operating margin profit margin of 9.7%, in line with the same quarter last year. This indicates the company’s cost structure has recently been stable.
Earnings Per Share
Revenue trends explain a company’s historical growth, but the long-term change in earnings per share (EPS) points to the profitability of that growth – for example, a company could inflate its sales through excessive spending on advertising and promotions.
Oshkosh’s EPS grew at an astounding 17.6% compounded annual growth rate over the last five years, higher than its 8.6% annualized revenue growth. This tells us the company became more profitable on a per-share basis as it expanded.
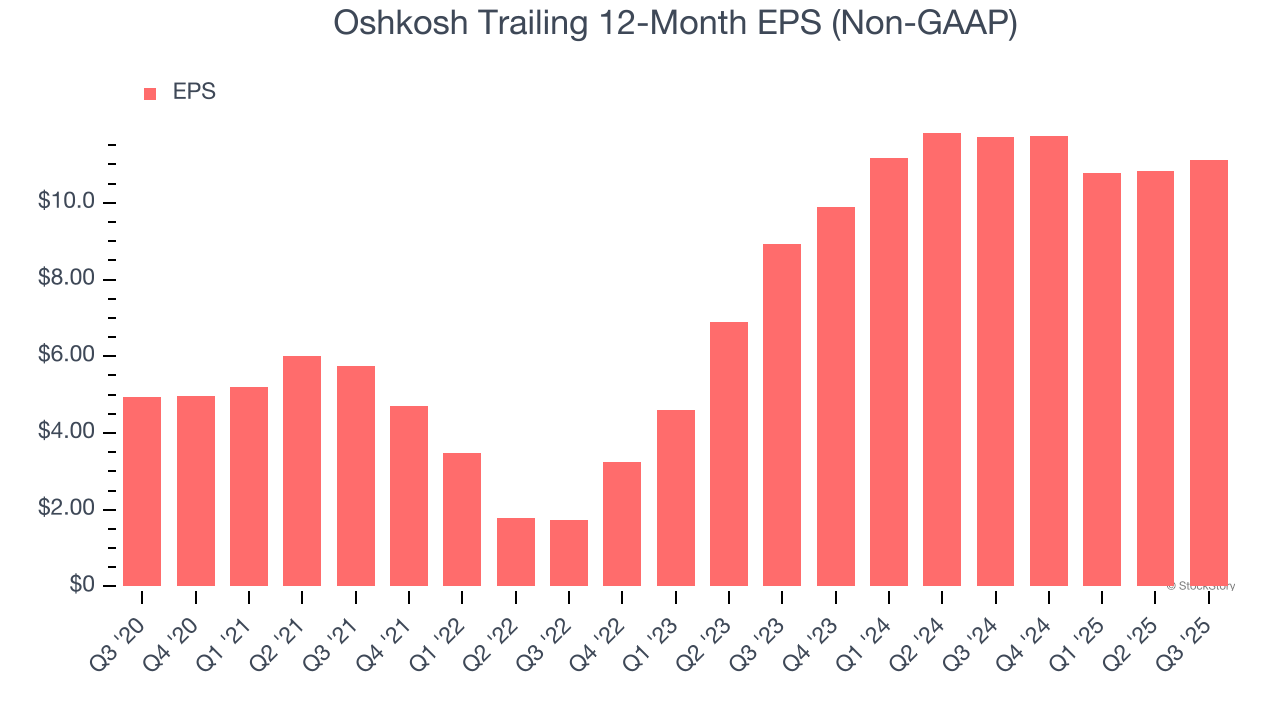
Diving into Oshkosh’s quality of earnings can give us a better understanding of its performance. As we mentioned earlier, Oshkosh’s operating margin was flat this quarter but expanded by 1.8 percentage points over the last five years. On top of that, its share count shrank by 6.1%. These are positive signs for shareholders because improving profitability and share buybacks turbocharge EPS growth relative to revenue growth. 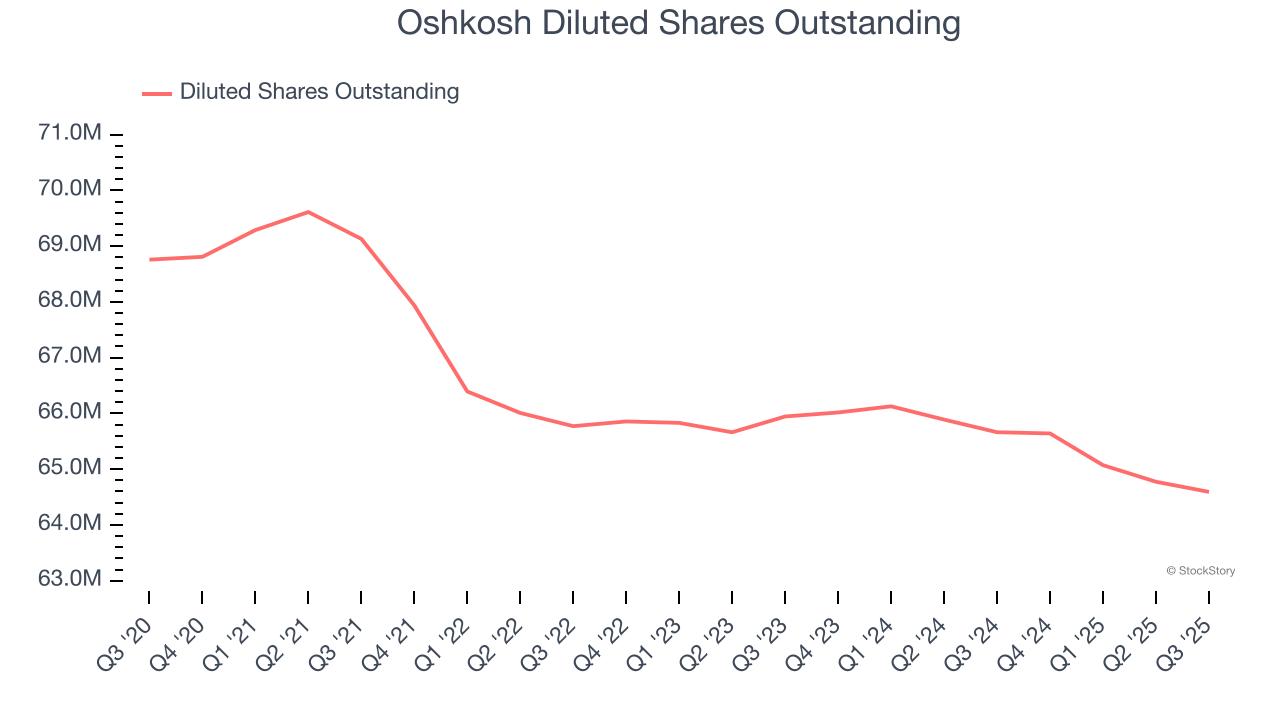
Like with revenue, we analyze EPS over a more recent period because it can provide insight into an emerging theme or development for the business.
For Oshkosh, its two-year annual EPS growth of 11.6% was lower than its five-year trend. We still think its growth was good and hope it can accelerate in the future.
In Q3, Oshkosh reported adjusted EPS of $3.20, up from $2.93 in the same quarter last year. This print beat analysts’ estimates by 3.3%. Over the next 12 months, Wall Street expects Oshkosh’s full-year EPS of $11.11 to grow 11%.
Key Takeaways from Oshkosh’s Q3 Results
We liked how Oshkosh beat analysts’ backlog expectations this quarter. On the other hand, its revenue and EBITDA both missed Wall Street’s estimates. Full-year guidance was also lowered. Overall, this was a weaker quarter. The stock traded down 4.5% to $131.35 immediately after reporting.
Oshkosh’s earnings report left more to be desired. Let’s look forward to see if this quarter has created an opportunity to buy the stock. We think that the latest quarter is only one piece of the longer-term business quality puzzle. Quality, when combined with valuation, can help determine if the stock is a buy. We cover that in our actionable full research report which you can read here, it’s free for active Edge members.


