
PCB manufacturing company TTM Technologies (NASDAQ: TTMI) reported Q3 CY2025 results topping the market’s revenue expectations, with sales up 22.1% year on year to $752.7 million. Guidance for next quarter’s revenue was optimistic at $750 million at the midpoint, 2.9% above analysts’ estimates. Its non-GAAP profit of $0.67 per share was 11.2% above analysts’ consensus estimates.
Is now the time to buy TTM Technologies? Find out by accessing our full research report, it’s free for active Edge members.
TTM Technologies (TTMI) Q3 CY2025 Highlights:
- Revenue: $752.7 million vs analyst estimates of $710.1 million (22.1% year-on-year growth, 6% beat)
- Adjusted EPS: $0.67 vs analyst estimates of $0.60 (11.2% beat)
- Adjusted EBITDA: $120.9 million vs analyst estimates of $109.2 million (16.1% margin, 10.8% beat)
- Revenue Guidance for Q4 CY2025 is $750 million at the midpoint, above analyst estimates of $728.7 million
- Adjusted EPS guidance for Q4 CY2025 is $0.67 at the midpoint, above analyst estimates of $0.63
- Operating Margin: 9.6%, up from 8.3% in the same quarter last year
- Free Cash Flow Margin: 5.7%, up from 3.9% in the same quarter last year
- Market Capitalization: $6.12 billion
Company Overview
As one of the world's largest printed circuit board manufacturers with facilities spanning North America and Asia, TTM Technologies (NASDAQ: TTMI) manufactures printed circuit boards (PCBs) and radio frequency (RF) components for aerospace, defense, automotive, and telecommunications industries.
Revenue Growth
Examining a company’s long-term performance can provide clues about its quality. Even a bad business can shine for one or two quarters, but a top-tier one grows for years.
With $2.78 billion in revenue over the past 12 months, TTM Technologies is a mid-sized business services company, which sometimes brings disadvantages compared to larger competitors benefiting from better economies of scale. On the bright side, it can still flex high growth rates because it’s working from a smaller revenue base.
As you can see below, TTM Technologies’s sales grew at a decent 5.6% compounded annual growth rate over the last five years. This shows its offerings generated slightly more demand than the average business services company, a useful starting point for our analysis.
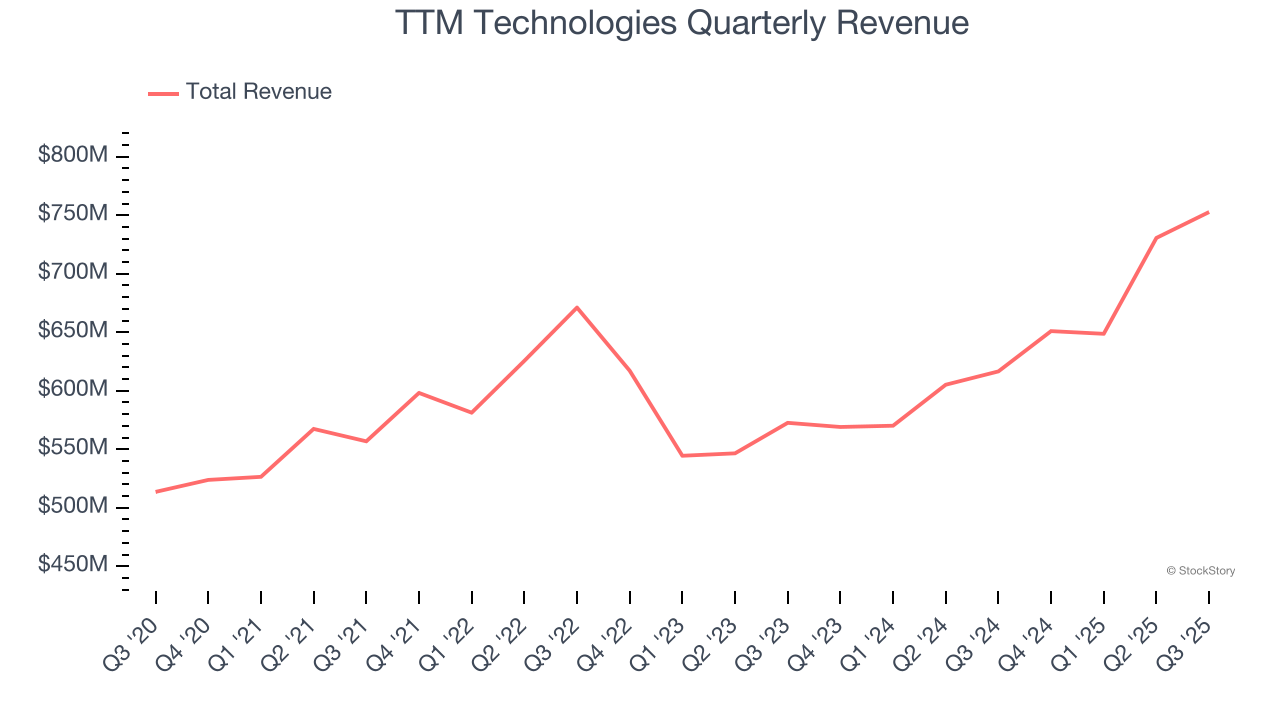
We at StockStory place the most emphasis on long-term growth, but within business services, a half-decade historical view may miss recent innovations or disruptive industry trends. TTM Technologies’s annualized revenue growth of 10.5% over the last two years is above its five-year trend, suggesting its demand recently accelerated. 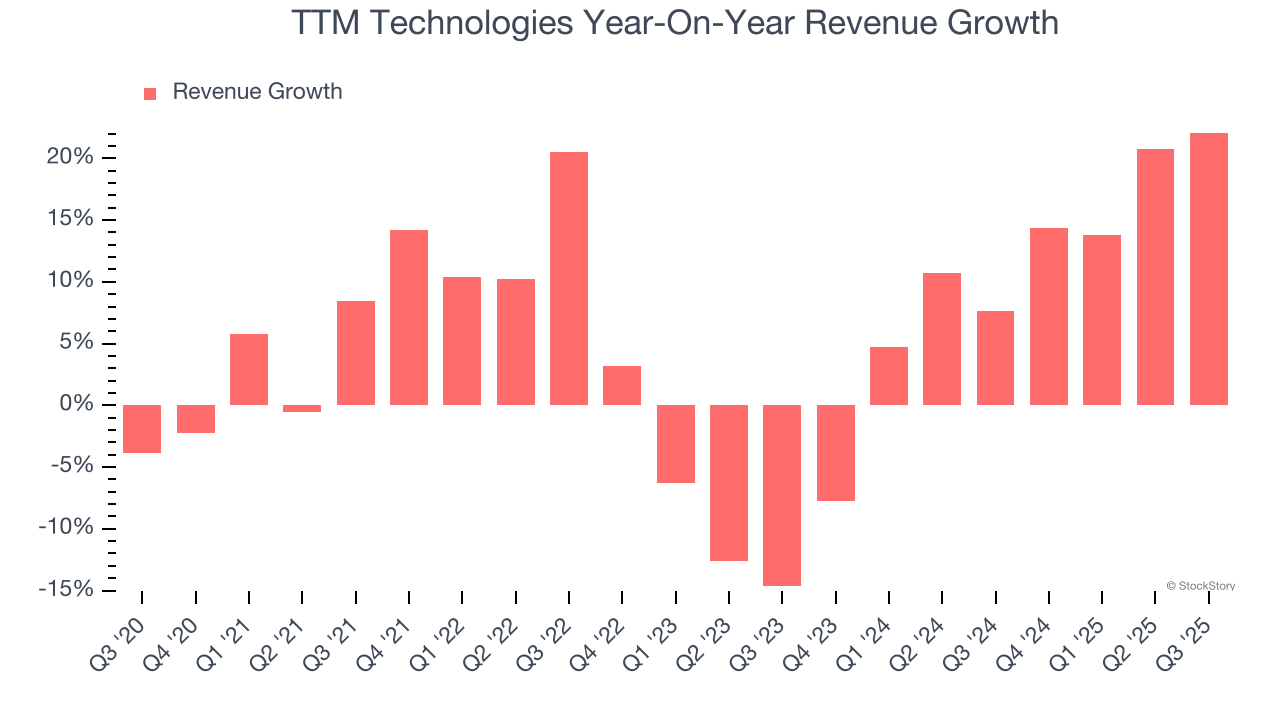
This quarter, TTM Technologies reported robust year-on-year revenue growth of 22.1%, and its $752.7 million of revenue topped Wall Street estimates by 6%. Company management is currently guiding for a 15.2% year-on-year increase in sales next quarter.
Looking further ahead, sell-side analysts expect revenue to grow 5.8% over the next 12 months, a deceleration versus the last two years. Still, this projection is above the sector average and indicates the market sees some success for its newer products and services.
Unless you’ve been living under a rock, it should be obvious by now that generative AI is going to have a huge impact on how large corporations do business. While Nvidia and AMD are trading close to all-time highs, we prefer a lesser-known (but still profitable) stock benefiting from the rise of AI. Click here to access our free report one of our favorites growth stories.
Operating Margin
Operating margin is an important measure of profitability as it shows the portion of revenue left after accounting for all core expenses – everything from the cost of goods sold to advertising and wages. It’s also useful for comparing profitability across companies with different levels of debt and tax rates because it excludes interest and taxes.
TTM Technologies was profitable over the last five years but held back by its large cost base. Its average operating margin of 5.9% was weak for a business services business.
On the plus side, TTM Technologies’s operating margin rose by 1.3 percentage points over the last five years, as its sales growth gave it operating leverage.
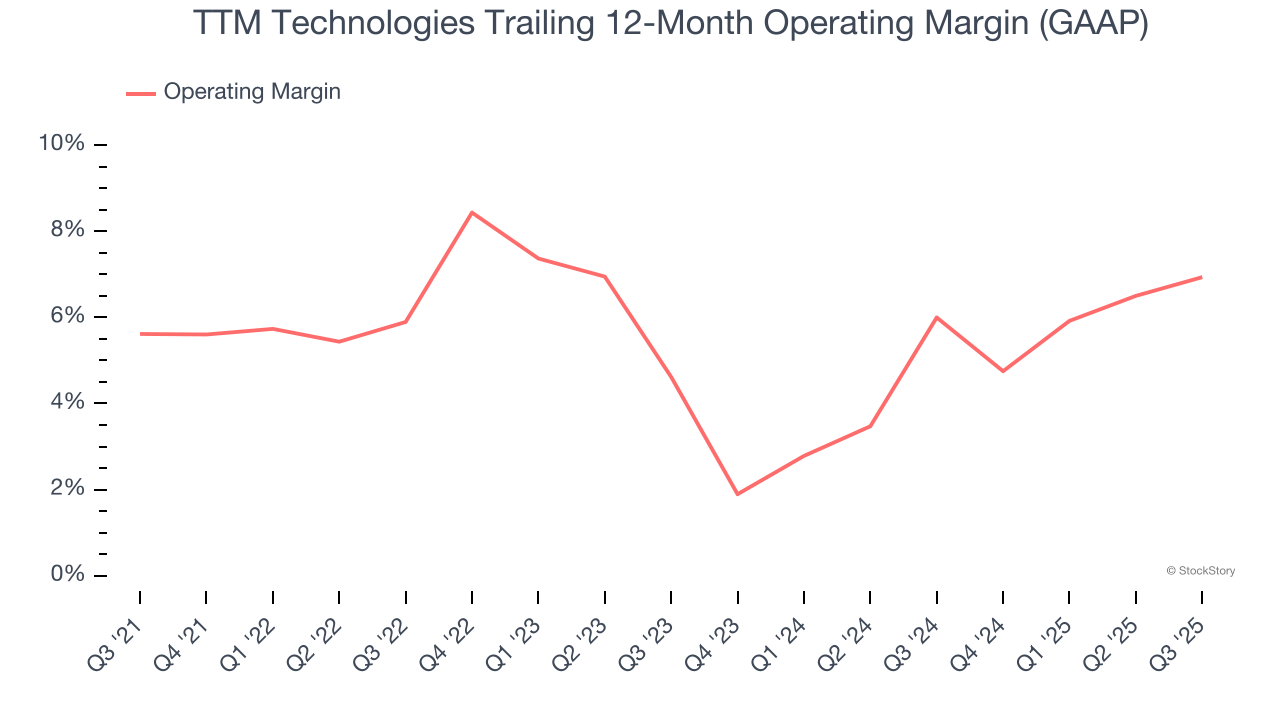
This quarter, TTM Technologies generated an operating margin profit margin of 9.6%, up 1.3 percentage points year on year. This increase was a welcome development and shows it was more efficient.
Earnings Per Share
Revenue trends explain a company’s historical growth, but the long-term change in earnings per share (EPS) points to the profitability of that growth – for example, a company could inflate its sales through excessive spending on advertising and promotions.
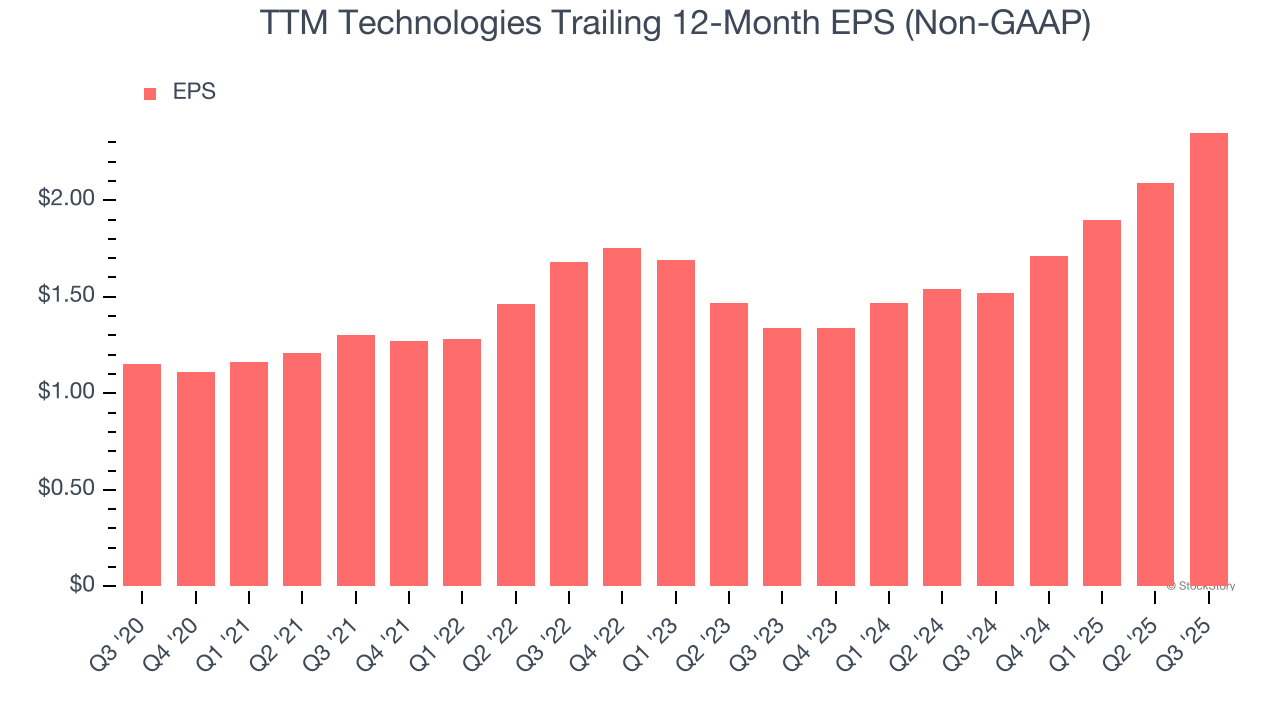
TTM Technologies’s EPS grew at an astounding 15.4% compounded annual growth rate over the last five years, higher than its 5.6% annualized revenue growth. This tells us the company became more profitable on a per-share basis as it expanded.
Diving into the nuances of TTM Technologies’s earnings can give us a better understanding of its performance. As we mentioned earlier, TTM Technologies’s operating margin expanded by 1.3 percentage points over the last five years. This was the most relevant factor (aside from the revenue impact) behind its higher earnings; interest expenses and taxes can also affect EPS but don’t tell us as much about a company’s fundamentals.
Like with revenue, we analyze EPS over a more recent period because it can provide insight into an emerging theme or development for the business.
For TTM Technologies, its two-year annual EPS growth of 32.4% was higher than its five-year trend. We love it when earnings growth accelerates, especially when it accelerates off an already high base.
In Q3, TTM Technologies reported adjusted EPS of $0.67, up from $0.41 in the same quarter last year. This print easily cleared analysts’ estimates, and shareholders should be content with the results. Over the next 12 months, Wall Street expects TTM Technologies’s full-year EPS of $2.35 to grow 7.4%.
Key Takeaways from TTM Technologies’s Q3 Results
We were impressed by how significantly TTM Technologies blew past analysts’ EPS guidance for next quarter expectations this quarter. We were also excited its revenue outperformed Wall Street’s estimates by a wide margin. Zooming out, we think this was a solid print. The stock traded up 2.5% to $65.15 immediately after reporting.
TTM Technologies had an encouraging quarter, but one earnings result doesn’t necessarily make the stock a buy. Let’s see if this is a good investment. What happened in the latest quarter matters, but not as much as longer-term business quality and valuation, when deciding whether to invest in this stock. We cover that in our actionable full research report which you can read here, it’s free for active Edge members.