CACI trades at $550.01 per share and has stayed right on track with the overall market, gaining 20.1% over the last six months. At the same time, the S&P 500 has returned 23.8%.
Is now a good time to buy CACI? Find out in our full research report, it’s free for active Edge members.
Why Does CACI Spark Debate?
Founded to commercialize SIMSCRIPT, CACI International (NYSE: CACI) offers defense, intelligence, and IT solutions to support national security and government transformation efforts.
Two Things to Like:
1. Surging Backlog Locks In Future Sales
Investors interested in Defense Contractors companies should track backlog in addition to reported revenue. This metric shows the value of outstanding orders that have not yet been executed or delivered, giving visibility into CACI’s future revenue streams.
CACI’s backlog punched in at $33.9 billion in the latest quarter, and over the last two years, its year-on-year growth averaged 11.3%. This performance was impressive and shows the company has a robust sales pipeline because it is accumulating more orders than it can fulfill. Its growth also suggests that customers are committing to CACI for the long term, enhancing the business’s predictability. 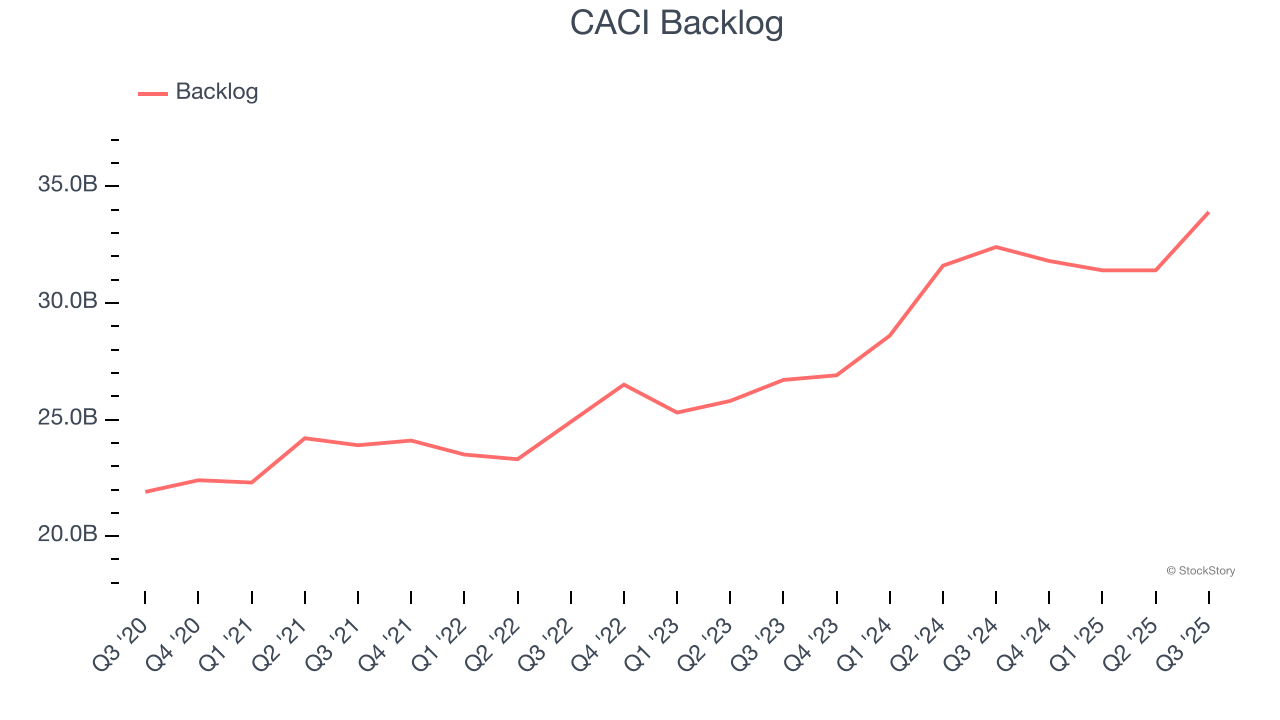
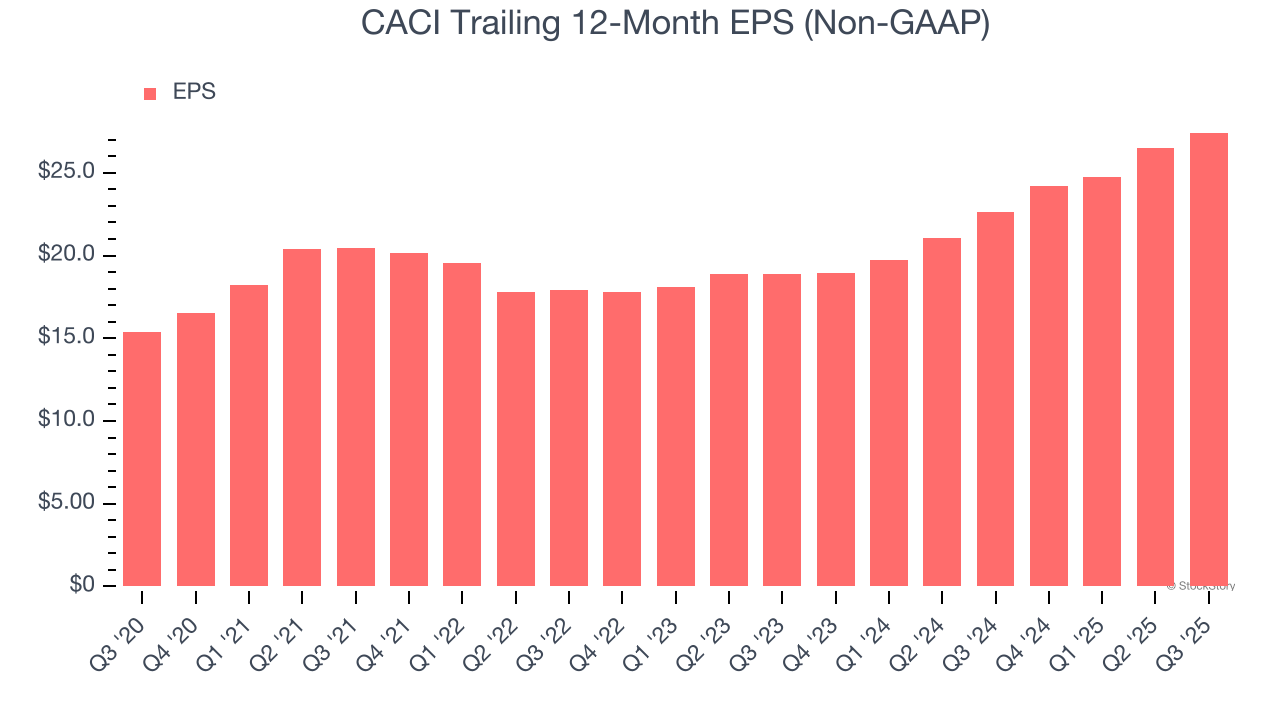
2. Outstanding Long-Term EPS Growth
Analyzing the long-term change in earnings per share (EPS) shows whether a company's incremental sales were profitable – for example, revenue could be inflated through excessive spending on advertising and promotions.
CACI’s EPS grew at a remarkable 12.3% compounded annual growth rate over the last five years, higher than its 8.8% annualized revenue growth. This tells us the company became more profitable on a per-share basis as it expanded.
One Reason to be Careful:
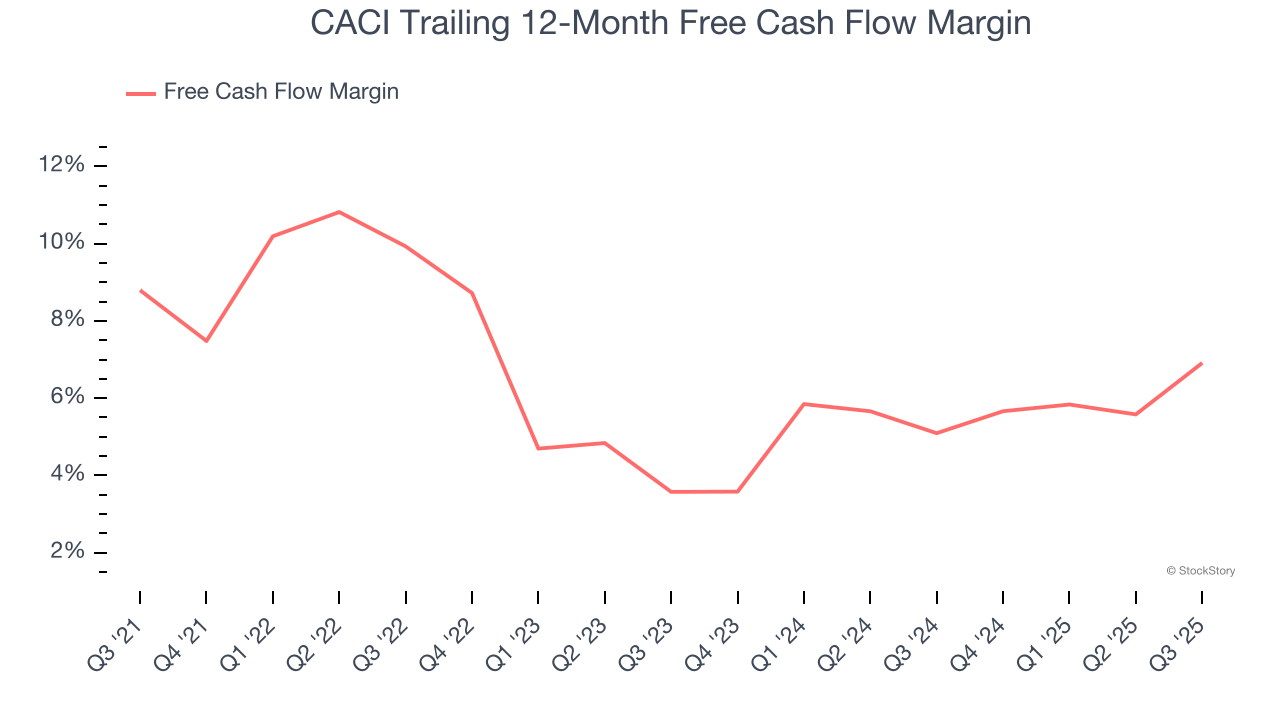
Free Cash Flow Margin Dropping
If you’ve followed StockStory for a while, you know we emphasize free cash flow. Why, you ask? We believe that in the end, cash is king, and you can’t use accounting profits to pay the bills.
As you can see below, CACI’s margin dropped by 1.9 percentage points over the last five years. If its declines continue, it could signal increasing investment needs and capital intensity. CACI’s free cash flow margin for the trailing 12 months was 6.9%.
Final Judgment
CACI’s merits more than compensate for its flaws, but at $550.01 per share (or 19.7× forward P/E), is now the time to initiate a position? See for yourself in our full research report, it’s free for active Edge members.
Stocks We Like Even More Than CACI
When Trump unveiled his aggressive tariff plan in April 2025, markets tanked as investors feared a full-blown trade war. But those who panicked and sold missed the subsequent rebound that’s already erased most losses.
Don’t let fear keep you from great opportunities and take a look at Top 9 Market-Beating Stocks. This is a curated list of our High Quality stocks that have generated a market-beating return of 183% over the last five years (as of March 31st 2025).
Stocks that made our list in 2020 include now familiar names such as Nvidia (+1,545% between March 2020 and March 2025) as well as under-the-radar businesses like the once-micro-cap company Kadant (+351% five-year return). Find your next big winner with StockStory today.
StockStory is growing and hiring equity analyst and marketing roles. Are you a 0 to 1 builder passionate about the markets and AI? See the open roles here.