
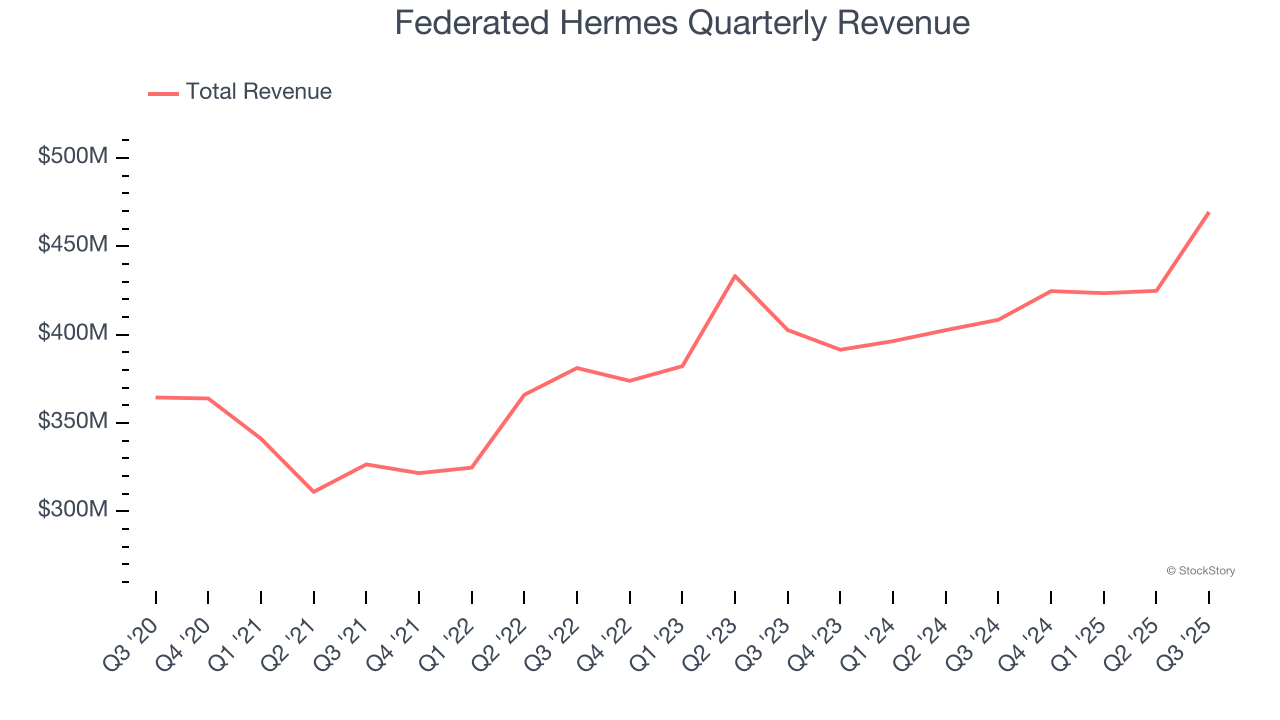
Investment management firm Federated Hermes (NYSE: FHI) reported Q3 CY2025 results beating Wall Street’s revenue expectations, with sales up 14.9% year on year to $469.4 million. Its GAAP profit of $1.34 per share was 19.2% above analysts’ consensus estimates.
Is now the time to buy Federated Hermes? Find out by accessing our full research report, it’s free for active Edge members.
Federated Hermes (FHI) Q3 CY2025 Highlights:
- Revenue: $469.4 million vs analyst estimates of $445.1 million (14.9% year-on-year growth, 5.5% beat)
- Pre-tax Profit: $140.3 million (29.9% margin, 14.5% year-on-year growth)
- EPS (GAAP): $1.34 vs analyst estimates of $1.12 (19.2% beat)
- Market Capitalization: $3.52 billion
"We saw record net sales of equity funds in the third quarter, driven by continued interest in our MDT equity and alternative quantitative investment offerings—a broad suite of quantitative investment solutions that employ a disciplined, bottom-up investment approach that fits a variety of portfolio structures as core or complementary strategies," said J. Christopher Donahue, president and chief executive officer.
Company Overview
With roots dating back to 1955 and a pioneering role in money market funds, Federated Hermes (NYSE: FHI) is an investment management firm that offers a wide range of funds and strategies for institutional and individual investors.
Revenue Growth
A company’s long-term sales performance can indicate its overall quality. Even a bad business can shine for one or two quarters, but a top-tier one grows for years. Over the last five years, Federated Hermes grew its revenue at a sluggish 3.9% compounded annual growth rate. This wasn’t a great result compared to the rest of the financials sector, but there are still things to like about Federated Hermes.
Long-term growth is the most important, but within financials, a half-decade historical view may miss recent interest rate changes and market returns. Federated Hermes’s annualized revenue growth of 4.6% over the last two years aligns with its five-year trend, suggesting its demand was consistently weak. 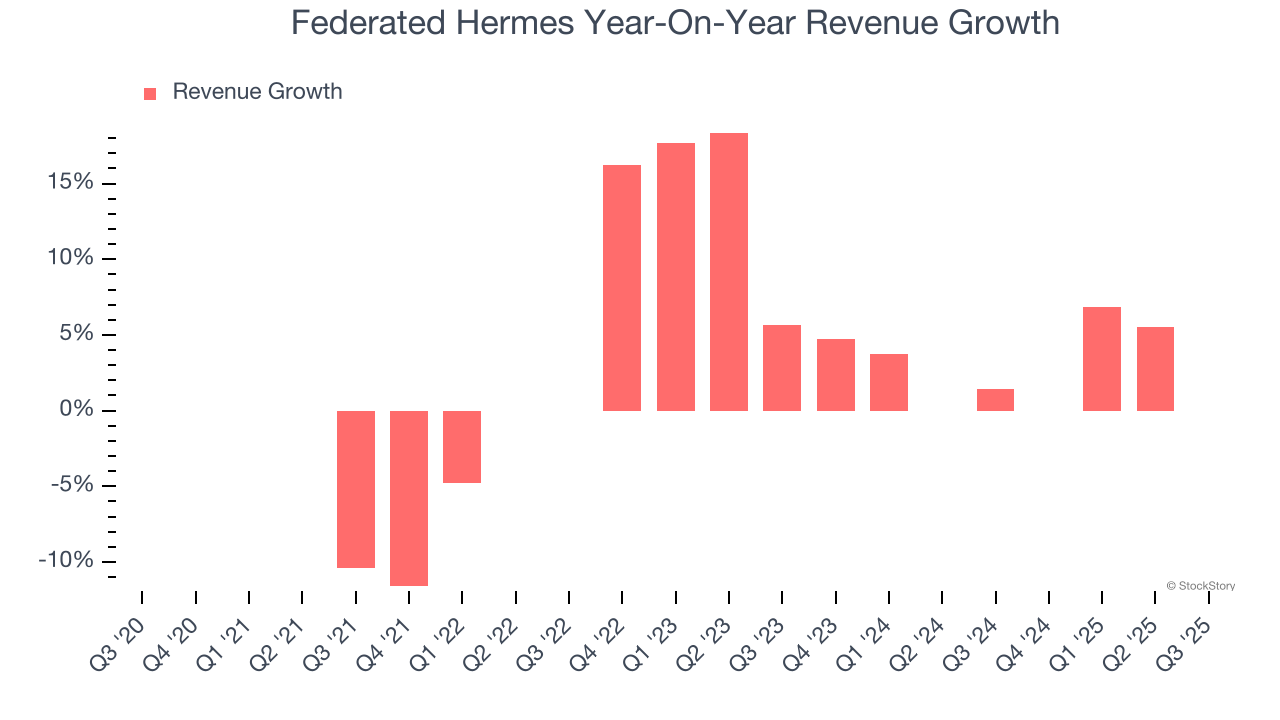 Note: Quarters not shown were determined to be outliers, impacted by outsized investment gains/losses that are not indicative of the recurring fundamentals of the business.
This quarter, Federated Hermes reported year-on-year revenue growth of 14.9%, and its $469.4 million of revenue exceeded Wall Street’s estimates by 5.5%.
Software is eating the world and there is virtually no industry left that has been untouched by it. That drives increasing demand for tools helping software developers do their jobs, whether it be monitoring critical cloud infrastructure, integrating audio and video functionality, or ensuring smooth content streaming. Click here to access a free report on our 3 favorite stocks to play this generational megatrend.
Key Takeaways from Federated Hermes’s Q3 Results
It was good to see Federated Hermes beat analysts’ EPS expectations this quarter. We were also glad its revenue outperformed Wall Street’s estimates. Zooming out, we think this quarter featured some important positives. The stock remained flat at $47.52 immediately after reporting.
Federated Hermes may have had a good quarter, but does that mean you should invest right now? When making that decision, it’s important to consider its valuation, business qualities, as well as what has happened in the latest quarter. We cover that in our actionable full research report which you can read here, it’s free for active Edge members.


