
Recreational boats manufacturer Malibu Boats (NASDAQ: MBUU) reported revenue ahead of Wall Streets expectations in Q3 CY2025, with sales up 13.5% year on year to $194.7 million. Its non-GAAP profit of $0.15 per share was 57.9% above analysts’ consensus estimates.
Is now the time to buy Malibu Boats? Find out by accessing our full research report, it’s free for active Edge members.
Malibu Boats (MBUU) Q3 CY2025 Highlights:
- Revenue: $194.7 million vs analyst estimates of $186.8 million (13.5% year-on-year growth, 4.3% beat)
- Adjusted EPS: $0.15 vs analyst estimates of $0.10 (57.9% beat)
- Adjusted EBITDA: $11.78 million vs analyst estimates of $10.41 million (6.1% margin, 13.2% beat)
- Operating Margin: -0.4%, up from -3.3% in the same quarter last year
- Market Capitalization: $626.8 million
“We delivered strong results in the first quarter in what continues to be a challenging market environment. Prioritizing dealer health remains central to our strategy, and our team executed with discipline to keep channel inventories aligned,” said Steve Menneto, President and Chief Executive Officer of Malibu Boats, Inc.
Company Overview
Founded in California in 1982, Malibu Boats (NASDAQ: MBUU) is a manufacturer of high-performance sports boats and luxury watercrafts.
Revenue Growth
Examining a company’s long-term performance can provide clues about its quality. Any business can put up a good quarter or two, but the best consistently grow over the long haul. Regrettably, Malibu Boats’s sales grew at a sluggish 4.6% compounded annual growth rate over the last five years. This fell short of our benchmark for the consumer discretionary sector and is a tough starting point for our analysis.
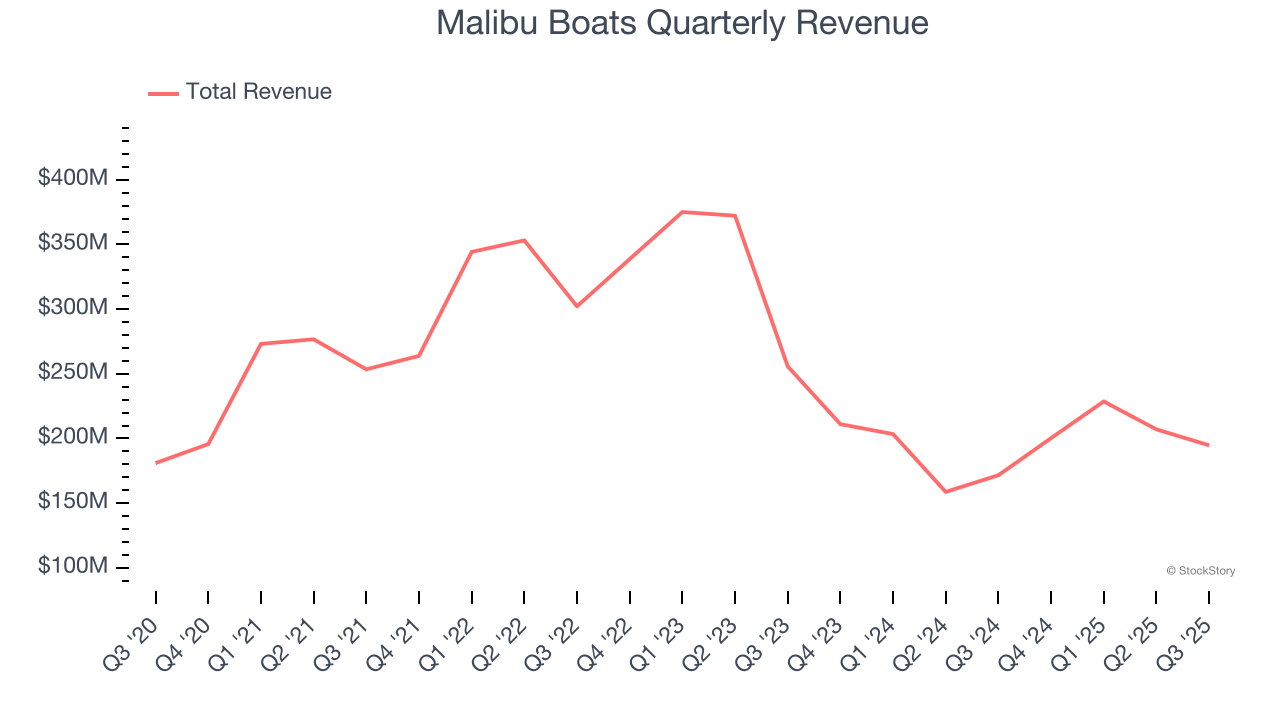
We at StockStory place the most emphasis on long-term growth, but within consumer discretionary, a stretched historical view may miss a company riding a successful new product or trend. Malibu Boats’s performance shows it grew in the past but relinquished its gains over the last two years, as its revenue fell by 21.3% annually. 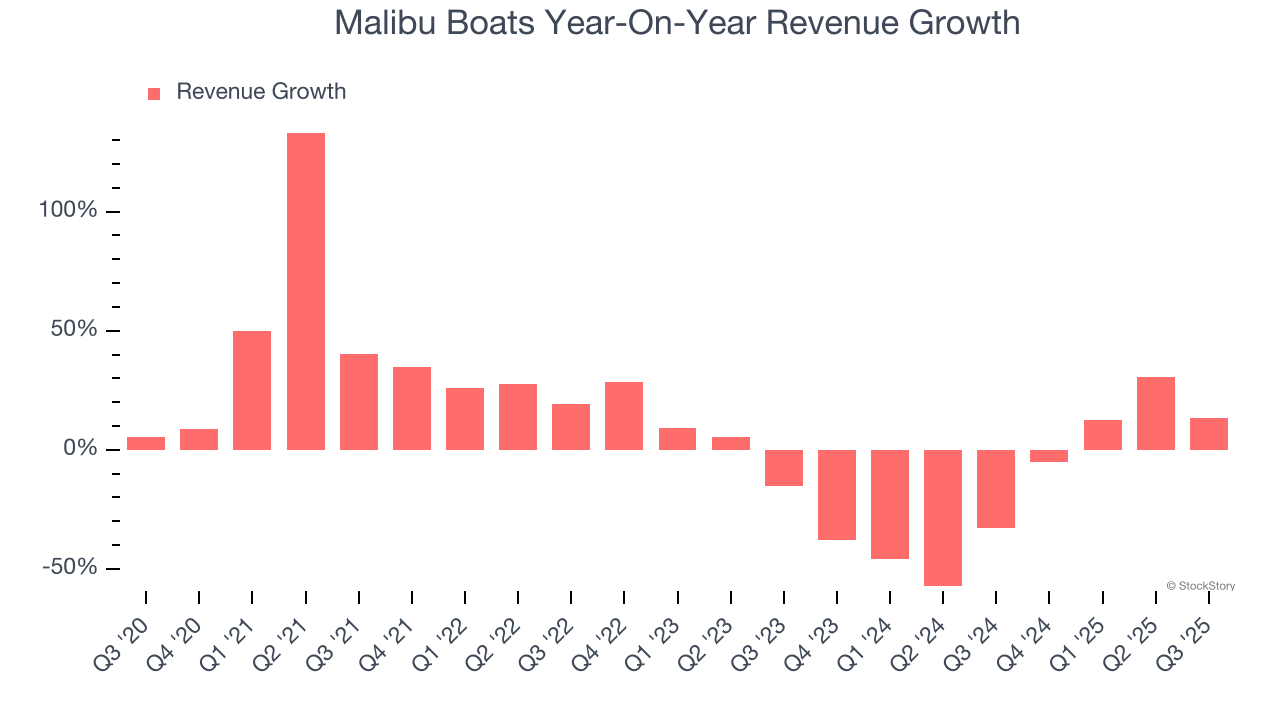
This quarter, Malibu Boats reported year-on-year revenue growth of 13.5%, and its $194.7 million of revenue exceeded Wall Street’s estimates by 4.3%.
Looking ahead, sell-side analysts expect revenue to decline by 2.7% over the next 12 months. While this projection is better than its two-year trend, it’s tough to feel optimistic about a company facing demand difficulties.
Here at StockStory, we certainly understand the potential of thematic investing. Diverse winners from Microsoft (MSFT) to Alphabet (GOOG), Coca-Cola (KO) to Monster Beverage (MNST) could all have been identified as promising growth stories with a megatrend driving the growth. So, in that spirit, we’ve identified a relatively under-the-radar profitable growth stock benefiting from the rise of AI, available to you FREE via this link.
Operating Margin
Operating margin is an important measure of profitability as it shows the portion of revenue left after accounting for all core expenses – everything from the cost of goods sold to advertising and wages. It’s also useful for comparing profitability across companies with different levels of debt and tax rates because it excludes interest and taxes.
Malibu Boats’s operating margin has risen over the last 12 months, but it still averaged negative 4% over the last two years. This is due to its large expense base and inefficient cost structure.
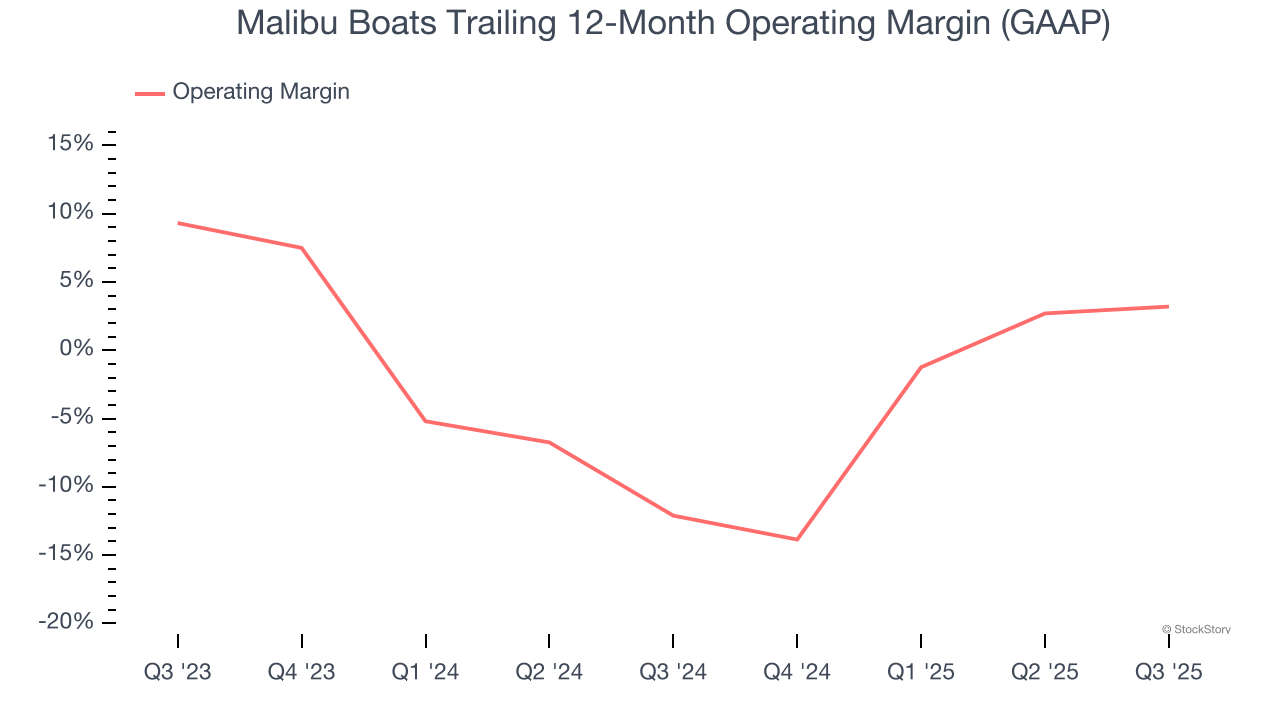
In Q3, Malibu Boats generated a negative 0.4% operating margin. The company's consistent lack of profits raise a flag.
Earnings Per Share
We track the long-term change in earnings per share (EPS) for the same reason as long-term revenue growth. Compared to revenue, however, EPS highlights whether a company’s growth is profitable.
Sadly for Malibu Boats, its EPS declined by 14.9% annually over the last five years while its revenue grew by 4.6%. This tells us the company became less profitable on a per-share basis as it expanded due to non-fundamental factors such as interest expenses and taxes.
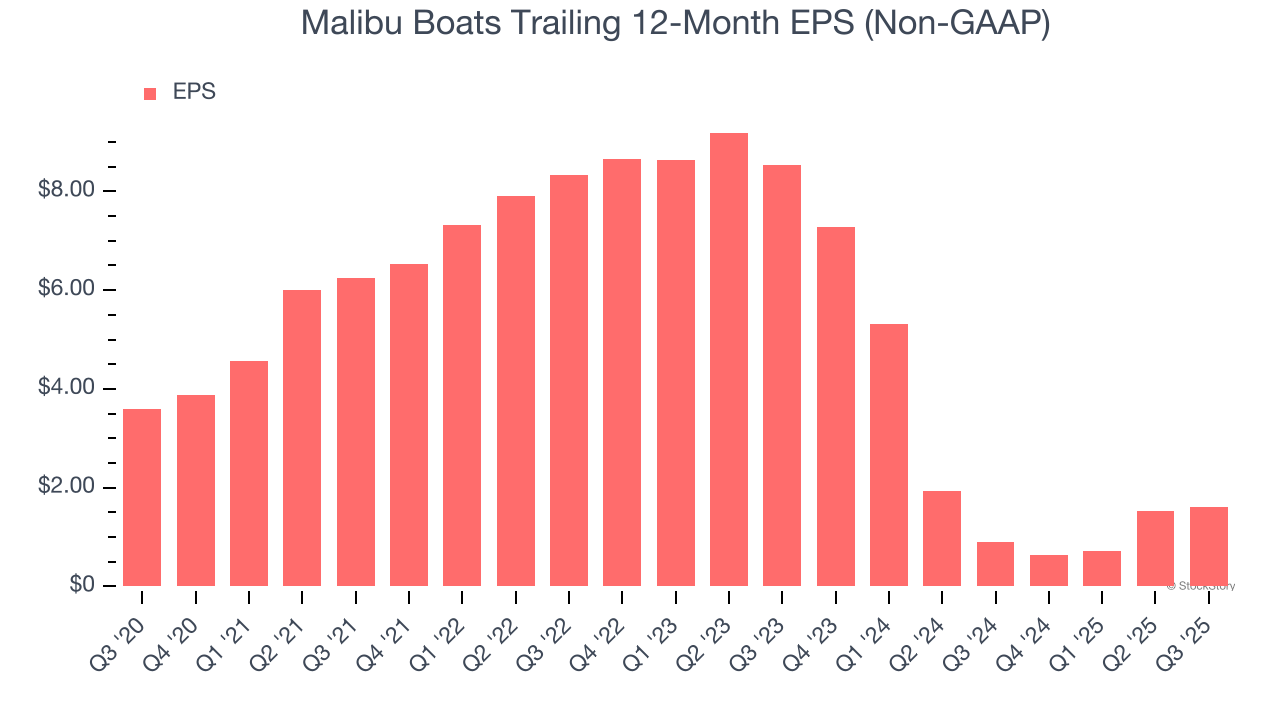
In Q3, Malibu Boats reported adjusted EPS of $0.15, up from $0.08 in the same quarter last year. This print easily cleared analysts’ estimates, and shareholders should be content with the results. Over the next 12 months, Wall Street expects Malibu Boats’s full-year EPS of $1.60 to shrink by 3.1%.
Key Takeaways from Malibu Boats’s Q3 Results
It was good to see Malibu Boats beat analysts’ EPS expectations this quarter. We were also glad its revenue outperformed Wall Street’s estimates. Zooming out, we think this quarter featured some important positives. The stock remained flat at $32.57 immediately after reporting.
So should you invest in Malibu Boats right now? If you’re making that decision, you should consider the bigger picture of valuation, business qualities, as well as the latest earnings. We cover that in our actionable full research report which you can read here, it’s free for active Edge members.


