
Online grocery delivery platform Instacart (NASDAQ: CART) beat Wall Street’s revenue expectations in Q3 CY2025, with sales up 10.2% year on year to $939 million. Its GAAP profit of $0.51 per share was 2.8% above analysts’ consensus estimates.
Is now the time to buy Instacart? Find out by accessing our full research report, it’s free for active Edge members.
Instacart (CART) Q3 CY2025 Highlights:
- Revenue: $939 million vs analyst estimates of $934.1 million (10.2% year-on-year growth, 0.5% beat)
- EPS (GAAP): $0.51 vs analyst estimates of $0.50 (2.8% beat)
- Adjusted EBITDA: $278 million vs analyst estimates of $267.1 million (29.6% margin, 4.1% beat)
- Operating Margin: 17.7%, up from 16.2% in the same quarter last year
- Free Cash Flow Margin: 29%, up from 20.5% in the previous quarter
- Market Capitalization: $9.68 billion
Company Overview
Powering more than one billion grocery orders since its founding, Instacart (NASDAQ: CART) is an online grocery shopping and delivery platform that partners with retailers to help customers shop from local stores through its app or website.
Revenue Growth
A company’s long-term sales performance is one signal of its overall quality. Any business can put up a good quarter or two, but the best consistently grow over the long haul. Over the last three years, Instacart grew its sales at a solid 17% compounded annual growth rate. Its growth surpassed the average consumer internet company and shows its offerings resonate with customers, a great starting point for our analysis.
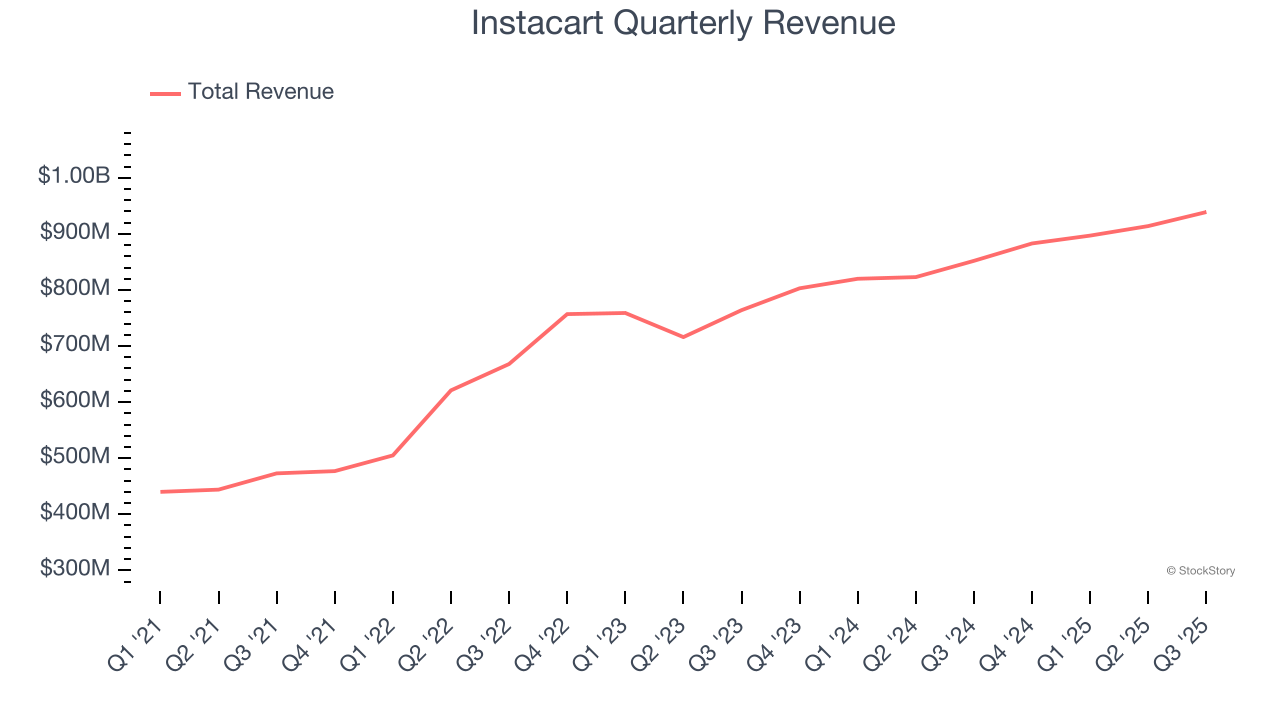
This quarter, Instacart reported year-on-year revenue growth of 10.2%, and its $939 million of revenue exceeded Wall Street’s estimates by 0.5%.
Looking ahead, sell-side analysts expect revenue to grow 9.7% over the next 12 months, a deceleration versus the last three years. This projection is underwhelming and indicates its products and services will see some demand headwinds. At least the company is tracking well in other measures of financial health.
Microsoft, Alphabet, Coca-Cola, Monster Beverage—all began as under-the-radar growth stories riding a massive trend. We’ve identified the next one: a profitable AI semiconductor play Wall Street is still overlooking. Go here for access to our full report.
Cash Is King
If you’ve followed StockStory for a while, you know we emphasize free cash flow. Why, you ask? We believe that in the end, cash is king, and you can’t use accounting profits to pay the bills.
Instacart has shown terrific cash profitability, driven by its lucrative business model and cost-effective customer acquisition strategy that enable it to stay ahead of the competition through investments in new products rather than sales and marketing. The company’s free cash flow margin was among the best in the consumer internet sector, averaging 22.8% over the last two years.
Taking a step back, we can see that Instacart’s margin expanded by 16.8 percentage points over the last few years. This is encouraging because it gives the company more optionality.
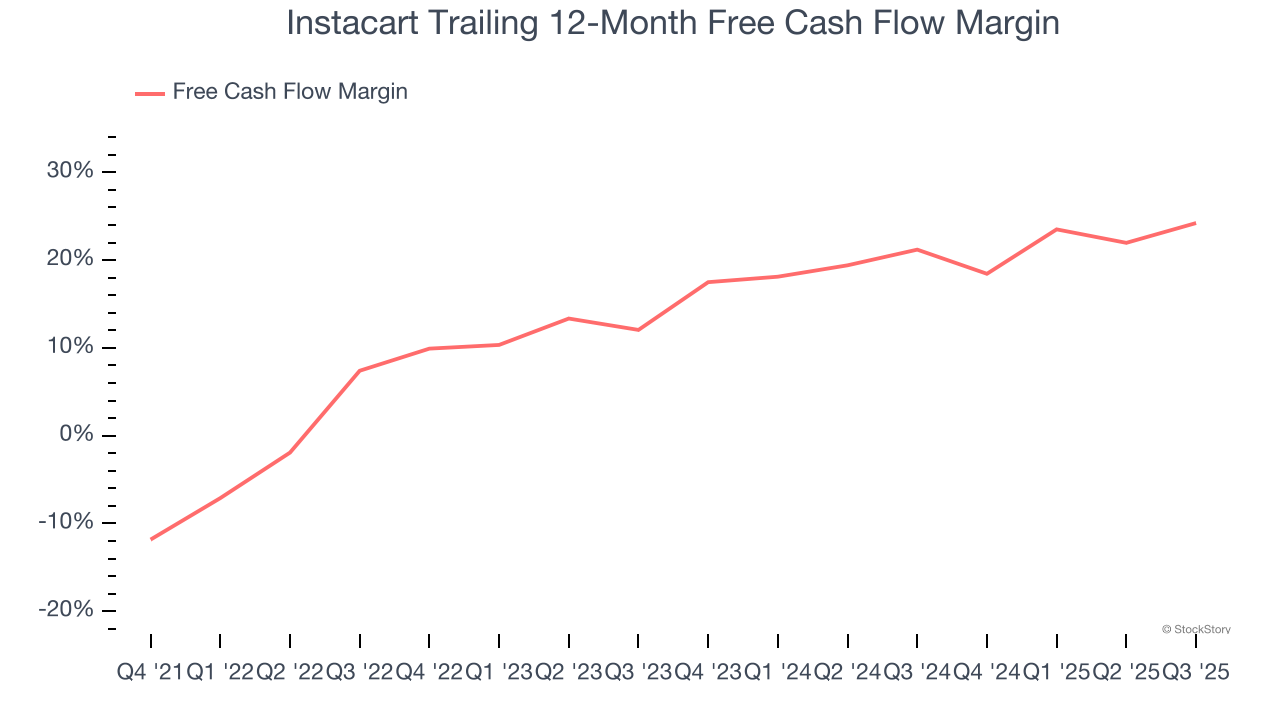
Instacart’s free cash flow clocked in at $272 million in Q3, equivalent to a 29% margin. This result was good as its margin was 8.9 percentage points higher than in the same quarter last year, building on its favorable historical trend.
Key Takeaways from Instacart’s Q3 Results
We enjoyed seeing Instacart beat analysts’ EBITDA expectations this quarter. Profit margins also rose year-on-year. Overall, this print had some key positives. The stock traded up 7.5% to $39.50 immediately after reporting.
Instacart may have had a good quarter, but does that mean you should invest right now? What happened in the latest quarter matters, but not as much as longer-term business quality and valuation, when deciding whether to invest in this stock. We cover that in our actionable full research report which you can read here, it’s free for active Edge members.


