
Since May 2025, Jefferies has been in a holding pattern, posting a small return of 1.1% while floating around $54.67. The stock also fell short of the S&P 500’s 15.3% gain during that period.
Is now the time to buy Jefferies, or should you be careful about including it in your portfolio? Get the full breakdown from our expert analysts, it’s free for active Edge members.
Why Is Jefferies Not Exciting?
We're sitting this one out for now. Here are three reasons we avoid JEF and a stock we'd rather own.
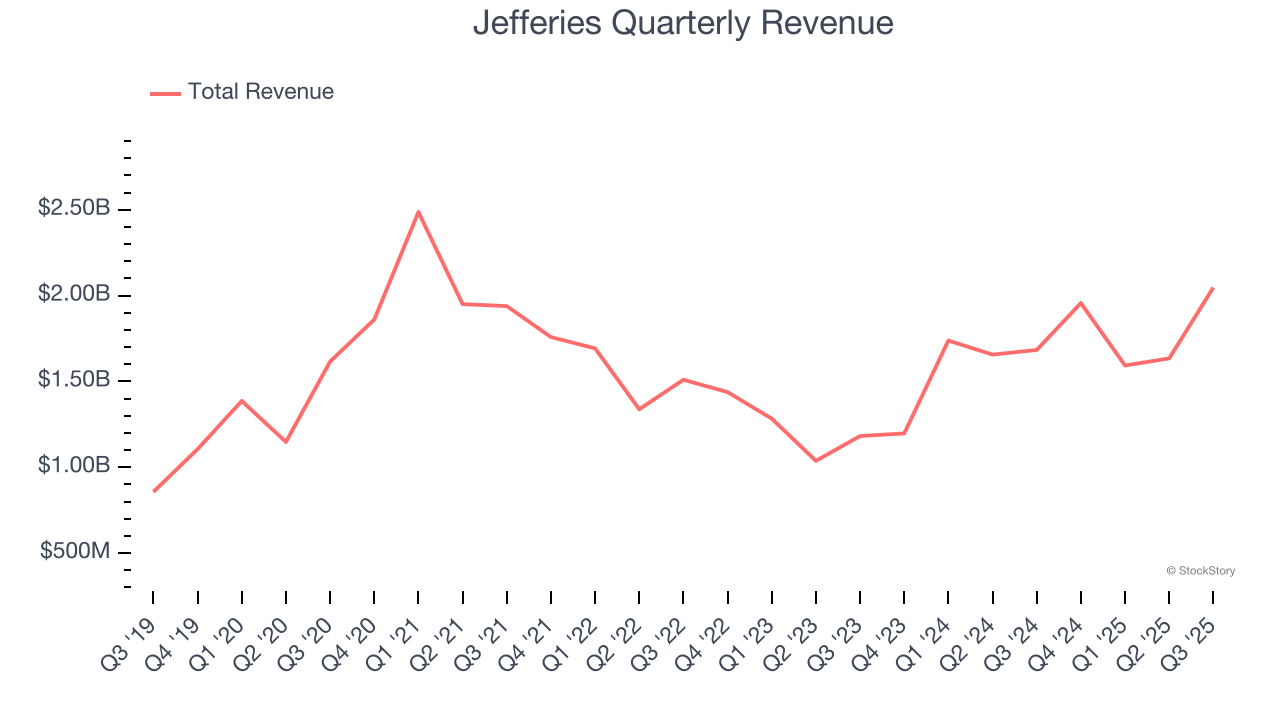
1. Long-Term Revenue Growth Disappoints
A company’s long-term performance is an indicator of its overall quality. Any business can experience short-term success, but top-performing ones enjoy sustained growth for years.
Unfortunately, Jefferies’s 6.6% annualized revenue growth over the last five years was mediocre. This was below our standard for the financials sector.
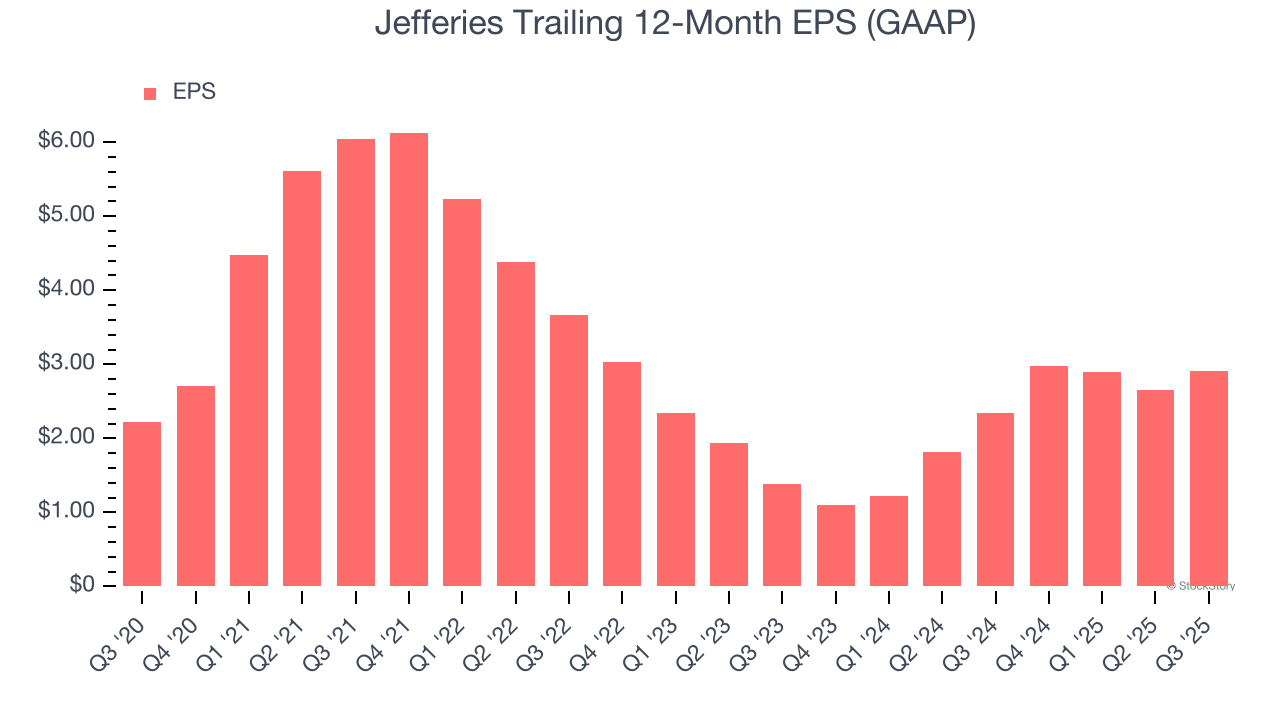
2. EPS Barely Growing
Analyzing the long-term change in earnings per share (EPS) shows whether a company's incremental sales were profitable – for example, revenue could be inflated through excessive spending on advertising and promotions.
Jefferies’s unimpressive 5.6% annual EPS growth over the last five years aligns with its revenue performance. This tells us it maintained its per-share profitability as it expanded.
3. High Debt Levels Increase Risk
Jefferies reported $12.57 billion of cash and $32.62 billion of debt on its balance sheet in the most recent quarter.
As investors in high-quality companies, we primarily focus on whether a company’s profits can support its debt.
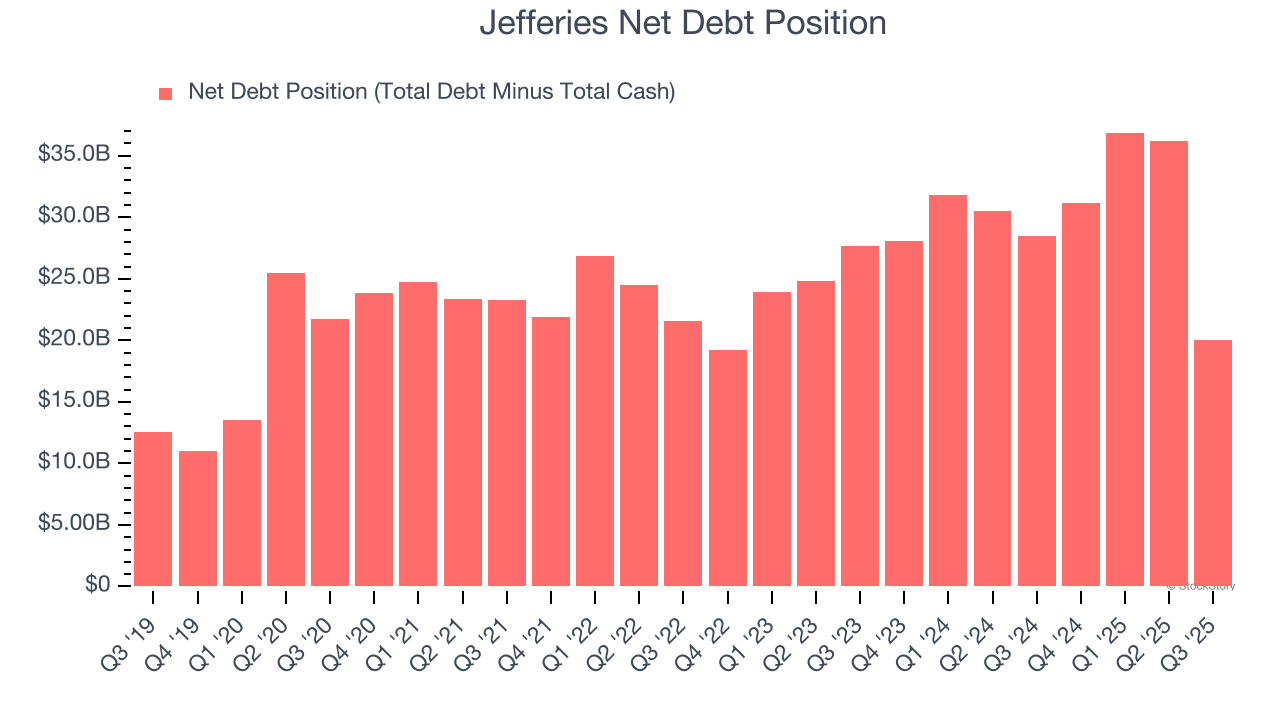
With $1.11 billion of EBITDA over the last 12 months, we view Jefferies’s 18.1× net-debt-to-EBITDA ratio as inadequate. The company’s lacking profits relative to its borrowings give it little breathing room, raising red flags.
Final Judgment
Jefferies isn’t a terrible business, but it doesn’t pass our bar. With its shares underperforming the market lately, the stock trades at 1.1× forward P/E (or $54.67 per share). Investors with a higher risk tolerance might like the company, but we think the potential downside is too great. We're fairly confident there are better investments elsewhere. We’d suggest looking at the Amazon and PayPal of Latin America.
High-Quality Stocks for All Market Conditions
Donald Trump’s April 2025 "Liberation Day" tariffs sent markets into a tailspin, but stocks have since rebounded strongly, proving that knee-jerk reactions often create the best buying opportunities.
The smart money is already positioning for the next leg up. Don’t miss out on the recovery - check out our Top 5 Growth Stocks for this month. This is a curated list of our High Quality stocks that have generated a market-beating return of 183% over the last five years (as of March 31st 2025).
Stocks that made our list in 2020 include now familiar names such as Nvidia (+1,545% between March 2020 and March 2025) as well as under-the-radar businesses like the once-small-cap company Exlservice (+354% five-year return). Find your next big winner with StockStory today.
StockStory is growing and hiring equity analyst and marketing roles. Are you a 0 to 1 builder passionate about the markets and AI? See the open roles here.