
Digital engagement platform ON24 (NYSE: ONTF) beat Wall Street’s revenue expectations in Q3 CY2025, but sales fell by 4.7% year on year to $34.6 million. The company expects next quarter’s revenue to be around $34.2 million, close to analysts’ estimates. Its non-GAAP profit of $0.03 per share was $0.02 above analysts’ consensus estimates.
Is now the time to buy ON24? Find out by accessing our full research report, it’s free for active Edge members.
ON24 (ONTF) Q3 CY2025 Highlights:
- Revenue: $34.6 million vs analyst estimates of $33.85 million (4.7% year-on-year decline, 2.2% beat)
- Adjusted EPS: $0.03 vs analyst estimates of $0.01 ($0.02 beat)
- Adjusted Operating Income: -$376,000 vs analyst estimates of -$1.08 million (-1.1% margin, relatively in line)
- Revenue Guidance for Q4 CY2025 is $34.2 million at the midpoint, roughly in line with what analysts were expecting
- Management raised its full-year Adjusted EPS guidance to $0.06 at the midpoint, a 57.1% increase
- Operating Margin: -23.1%, up from -36.7% in the same quarter last year
- Free Cash Flow Margin: 6.2%, similar to the previous quarter
- Billings: $30.21 million at quarter end, down 11% year on year
- Market Capitalization: $209 million
Company Overview
Powering over 1,700 companies' virtual marketing efforts since 1998, ON24 (NYSE: ONTF) provides a cloud-based platform that enables businesses to create interactive digital experiences and capture actionable data from customer engagement.
Revenue Growth
A company’s long-term performance is an indicator of its overall quality. Any business can experience short-term success, but top-performing ones enjoy sustained growth for years. Over the last five years, ON24 grew its sales at a weak 2.1% compounded annual growth rate. This fell short of our benchmarks and is a rough starting point for our analysis.
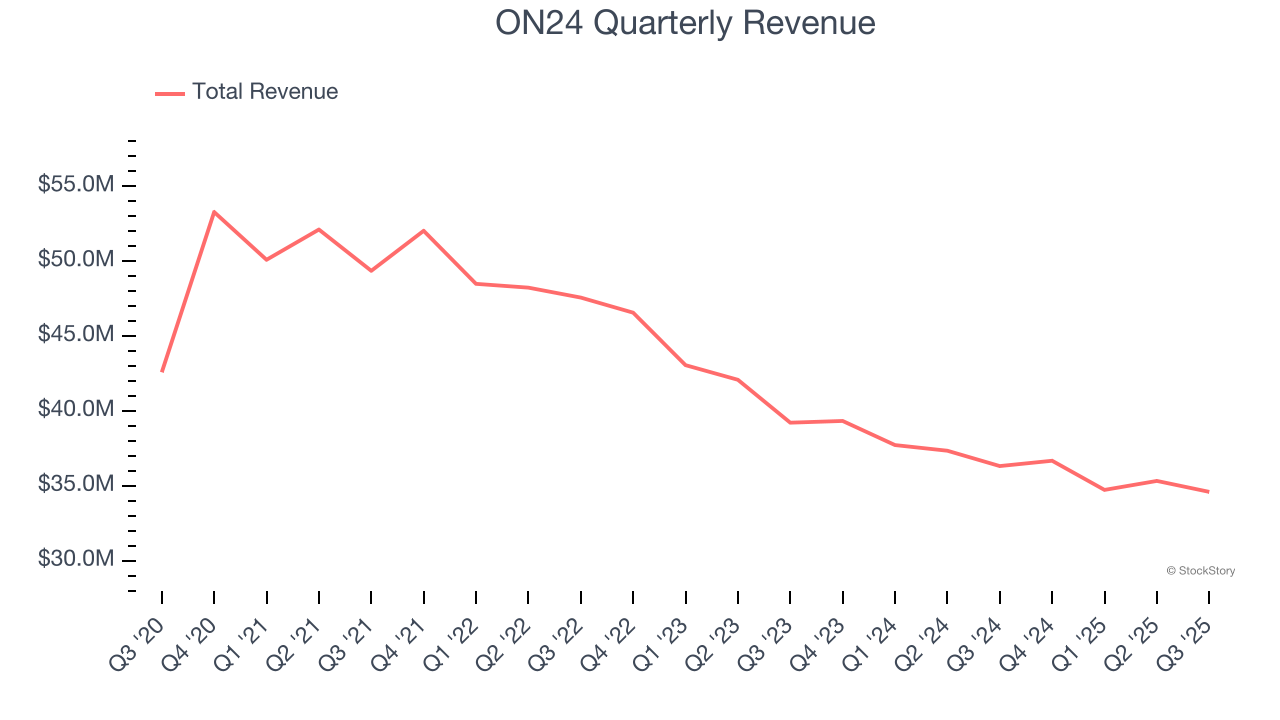
We at StockStory place the most emphasis on long-term growth, but within software, a half-decade historical view may miss recent innovations or disruptive industry trends. ON24’s performance shows it grew in the past but relinquished its gains over the last two years, as its revenue fell by 9.1% annually. 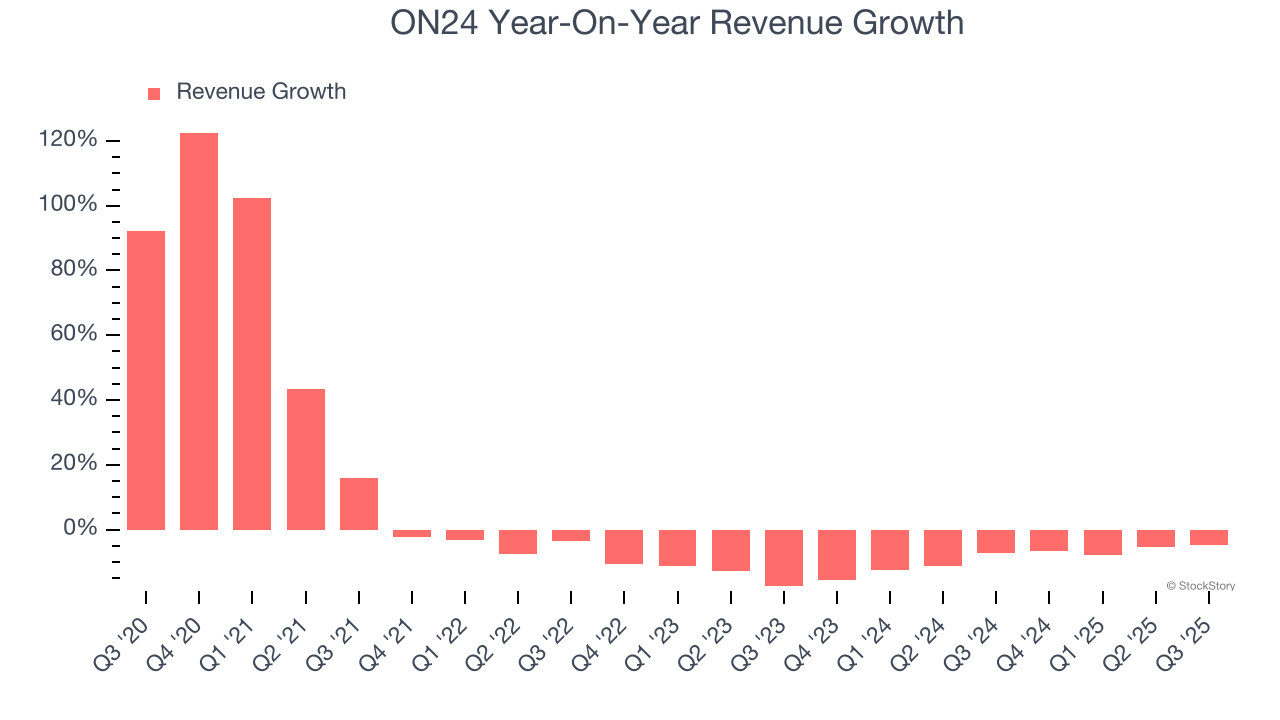
This quarter, ON24’s revenue fell by 4.7% year on year to $34.6 million but beat Wall Street’s estimates by 2.2%. Company management is currently guiding for a 6.8% year-on-year decline in sales next quarter.
Looking further ahead, sell-side analysts expect revenue to decline by 3.4% over the next 12 months. Although this projection is better than its two-year trend, it’s tough to feel optimistic about a company facing demand difficulties.
The 1999 book Gorilla Game predicted Microsoft and Apple would dominate tech before it happened. Its thesis? Identify the platform winners early. Today, enterprise software companies embedding generative AI are becoming the new gorillas. a profitable, fast-growing enterprise software stock that is already riding the automation wave and looking to catch the generative AI next.
Billings
Billings is a non-GAAP metric that is often called “cash revenue” because it shows how much money the company has collected from customers in a certain period. This is different from revenue, which must be recognized in pieces over the length of a contract.
ON24’s billings came in at $30.21 million in Q3, and it averaged 8.1% year-on-year declines over the last four quarters. This performance mirrored its total sales and shows the company faced challenges in acquiring and retaining customers. It also suggests there may be increasing competition or market saturation. 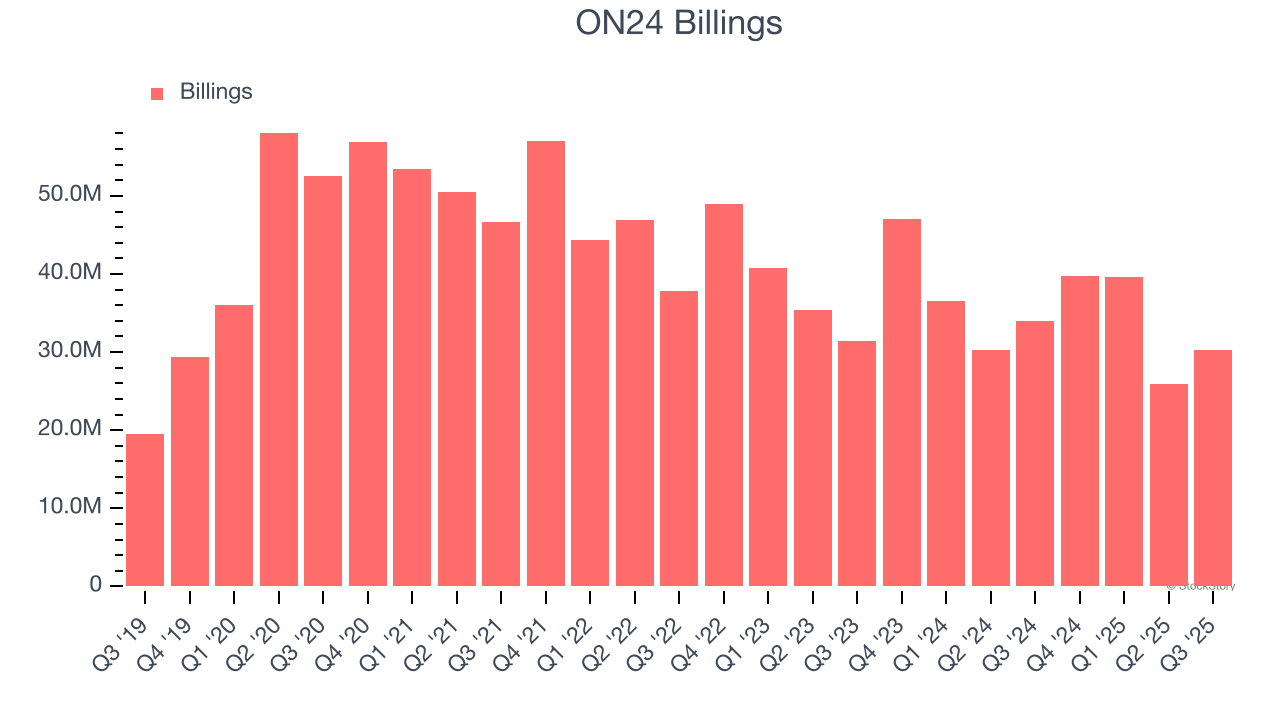
Customer Acquisition Efficiency
The customer acquisition cost (CAC) payback period represents the months required to recover the cost of acquiring a new customer. Essentially, it’s the break-even point for sales and marketing investments. A shorter CAC payback period is ideal, as it implies better returns on investment and business scalability.
It’s relatively expensive for ON24 to acquire new customers as its CAC payback period checked in at 50.6 months this quarter. The company’s slow recovery of its sales and marketing expenses indicates it operates in a highly competitive market and must invest to stand out, even if the return on that investment is low.
Key Takeaways from ON24’s Q3 Results
We were impressed by how significantly ON24 blew past analysts’ EBITDA expectations this quarter. We were also glad its full-year EPS guidance trumped Wall Street’s estimates. On the other hand, its EPS guidance for next quarter missed and its billings fell short of Wall Street’s estimates. Zooming out, we think this was a mixed quarter. The stock traded up 8.8% to $5.42 immediately after reporting.
Is ON24 an attractive investment opportunity at the current price? When making that decision, it’s important to consider its valuation, business qualities, as well as what has happened in the latest quarter. We cover that in our actionable full research report which you can read here, it’s free for active Edge members.