Baxter has gotten torched over the last six months - since May 2025, its stock price has dropped 44.3% to $17.76 per share. This was partly driven by its softer quarterly results and might have investors contemplating their next move.
Is now the time to buy Baxter, or should you be careful about including it in your portfolio? Get the full breakdown from our expert analysts, it’s free for active Edge members.
Why Do We Think Baxter Will Underperform?
Despite the more favorable entry price, we're swiping left on Baxter for now. Here are three reasons we avoid BAX and a stock we'd rather own.
1. Weak Constant Currency Growth Points to Soft Demand
Investors interested in Medical Devices & Supplies - Diversified companies should track constant currency revenue in addition to reported revenue. This metric excludes currency movements, which are outside of Baxter’s control and are not indicative of underlying demand.
Over the last two years, Baxter’s constant currency revenue averaged 4.1% year-on-year growth. This performance slightly lagged the sector and suggests it might have to lower prices or invest in product improvements to accelerate growth, factors that can hinder near-term profitability. 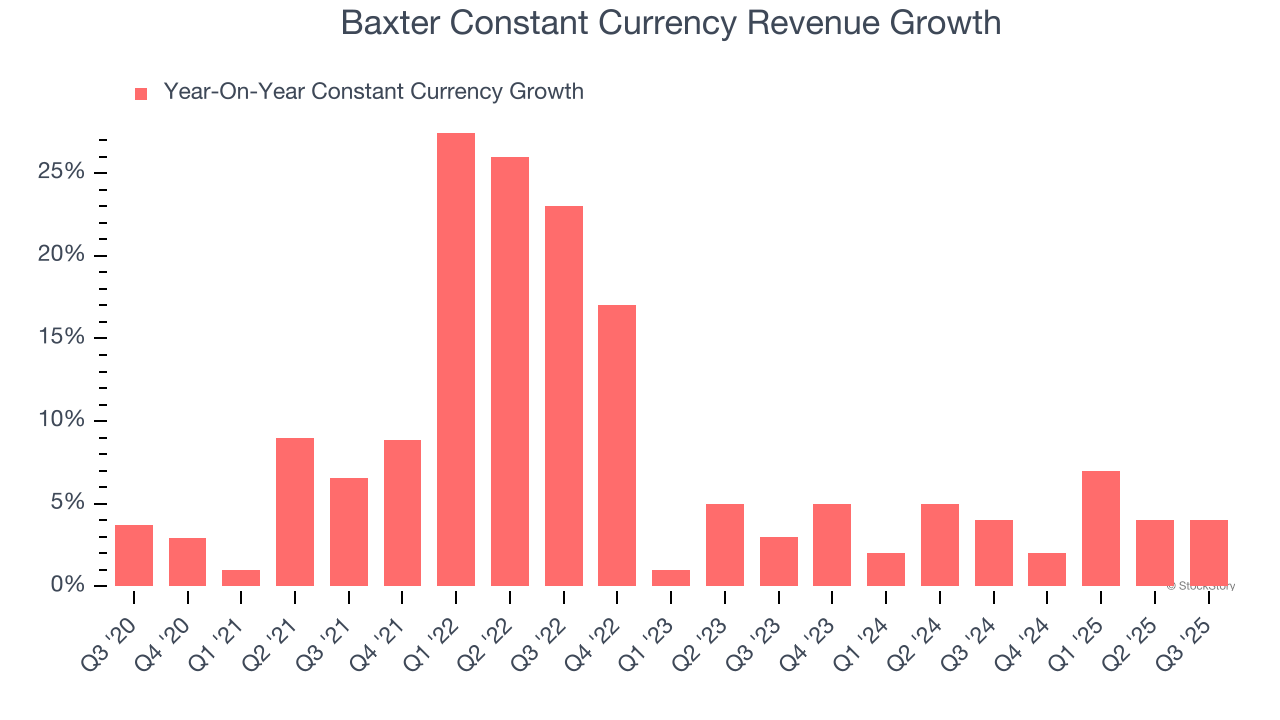
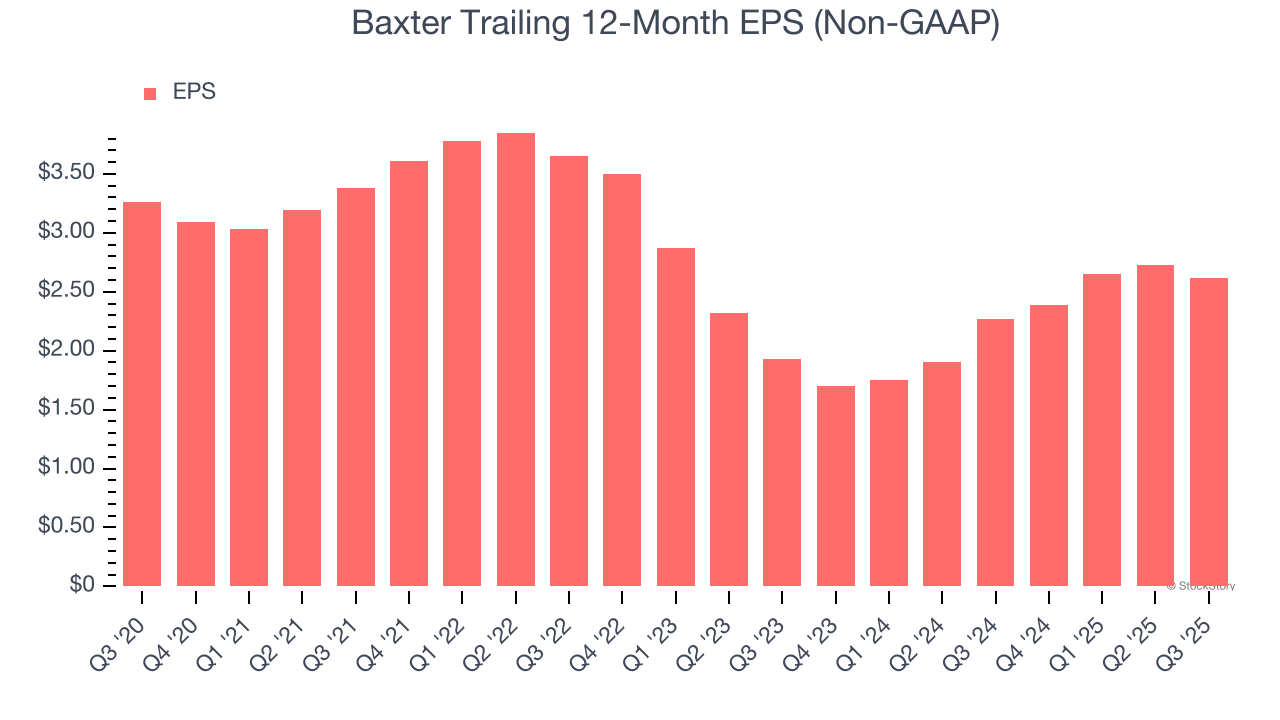
2. EPS Trending Down
We track the long-term change in earnings per share (EPS) because it highlights whether a company’s growth is profitable.
Sadly for Baxter, its EPS declined by 4.3% annually over the last five years while its revenue was flat. This tells us the company struggled because its fixed cost base made it difficult to adjust to choppy demand.
3. Previous Growth Initiatives Haven’t Impressed
Growth gives us insight into a company’s long-term potential, but how capital-efficient was that growth? Enter ROIC, a metric showing how much operating profit a company generates relative to the money it has raised (debt and equity).
Baxter historically did a mediocre job investing in profitable growth initiatives. Its five-year average ROIC was 1.1%, lower than the typical cost of capital (how much it costs to raise money) for healthcare companies.

Final Judgment
We see the value of companies making people healthier, but in the case of Baxter, we’re out. Following the recent decline, the stock trades at 8.1× forward P/E (or $17.76 per share). While this valuation is optically cheap, the potential downside is huge given its shaky fundamentals. There are better investments elsewhere. We’d suggest looking at one of our top digital advertising picks.
High-Quality Stocks for All Market Conditions
Trump’s April 2025 tariff bombshell triggered a massive market selloff, but stocks have since staged an impressive recovery, leaving those who panic sold on the sidelines.
Take advantage of the rebound by checking out our Top 5 Strong Momentum Stocks for this week. This is a curated list of our High Quality stocks that have generated a market-beating return of 183% over the last five years (as of March 31st 2025).
Stocks that made our list in 2020 include now familiar names such as Nvidia (+1,545% between March 2020 and March 2025) as well as under-the-radar businesses like the once-micro-cap company Tecnoglass (+1,754% five-year return). Find your next big winner with StockStory today.
StockStory is growing and hiring equity analyst and marketing roles. Are you a 0 to 1 builder passionate about the markets and AI? See the open roles here.