
Progressive’s stock price has taken a beating over the past six months, shedding 22.5% of its value and falling to $223.29 per share. This was partly driven by its softer quarterly results and might have investors contemplating their next move.
Following the pullback, is this a buying opportunity for PGR? Find out in our full research report, it’s free for active Edge members.
Why Are We Positive On Progressive?
Starting as a small auto insurance company in 1937 with a pioneering focus on high-risk drivers, Progressive (NYSE: PGR) is a major auto, property, and commercial insurance provider that offers policies through independent agents, online platforms, and over the phone.
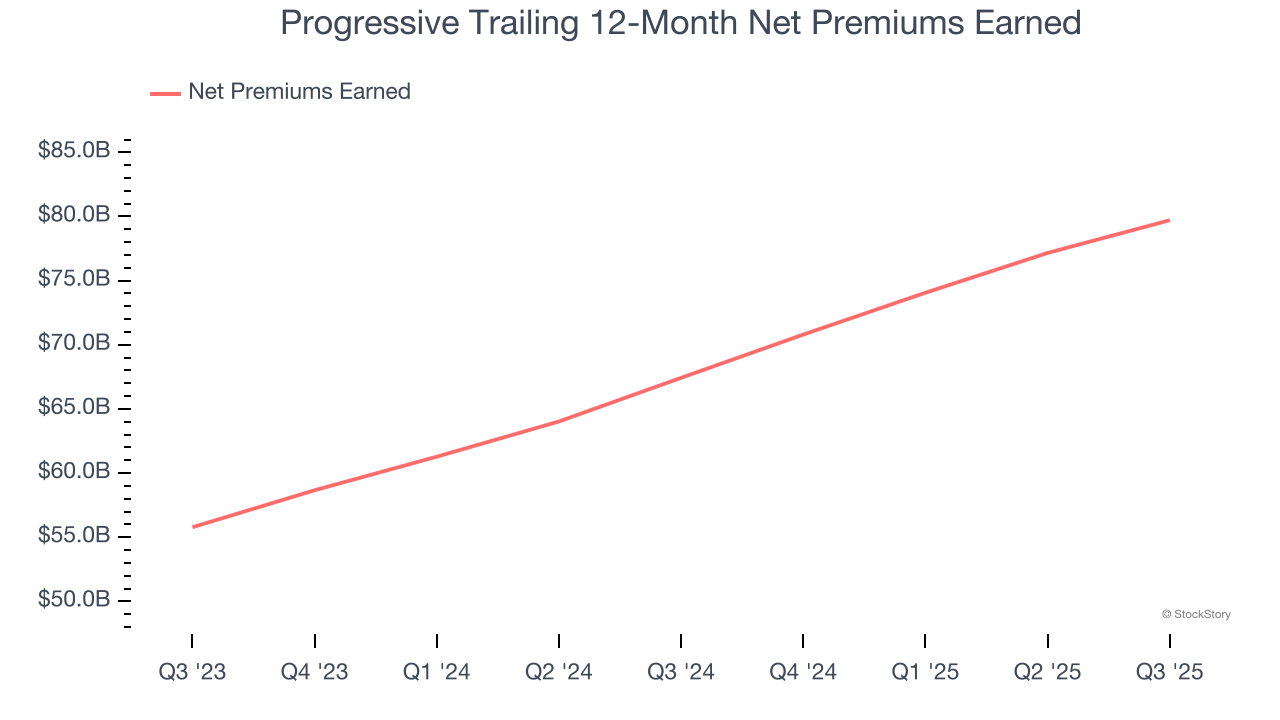
1. Net Premiums Earned Skyrocket, Fueling Growth Opportunities
When insurers sell policies, they protect themselves from extremely large losses or an outsized accumulation of losses with reinsurance (insurance for insurance companies). Net premiums earned are:
- Gross premiums - what’s ceded to reinsurers as a risk mitigation and transfer strategy
Progressive’s net premiums earned has grown at a 19.5% annualized rate over the last two years, much better than the broader insurance industry and in line with its total revenue.
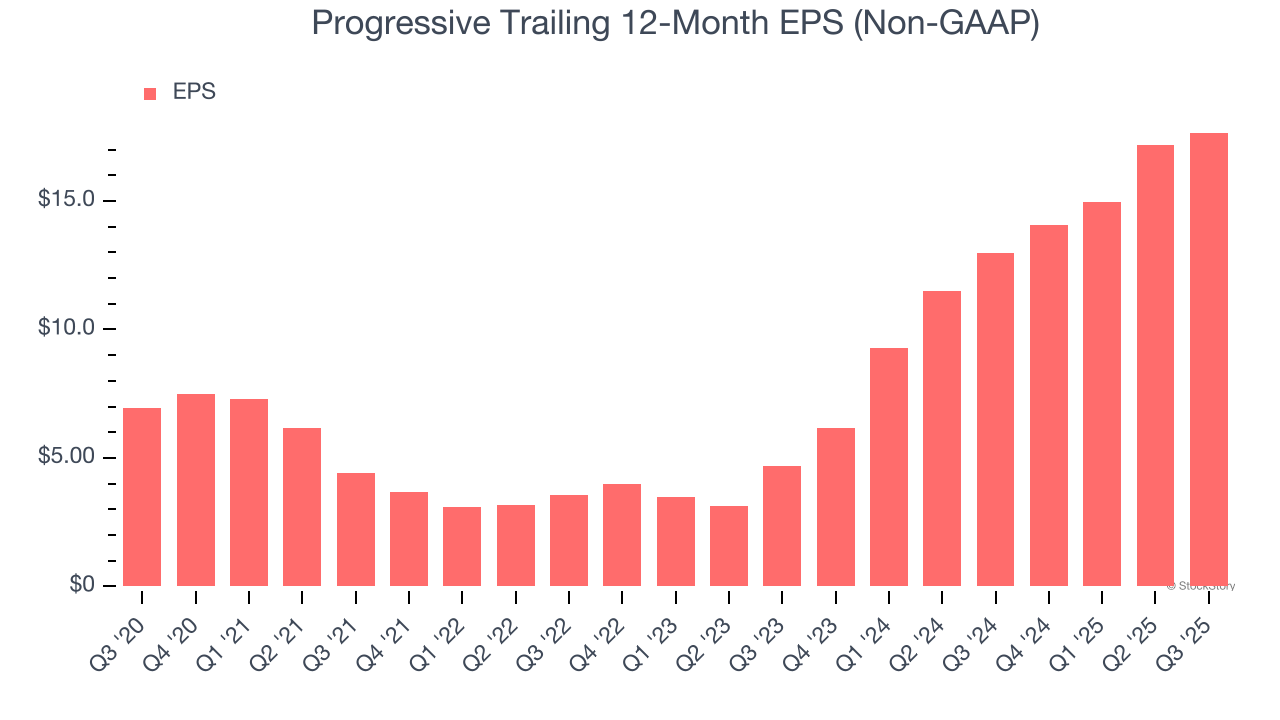
2. Outstanding Long-Term EPS Growth
We track the long-term change in earnings per share (EPS) because it highlights whether a company’s growth is profitable.
Progressive’s EPS grew at a remarkable 20.5% compounded annual growth rate over the last five years, higher than its 15.2% annualized revenue growth. This tells us the company became more profitable on a per-share basis as it expanded.
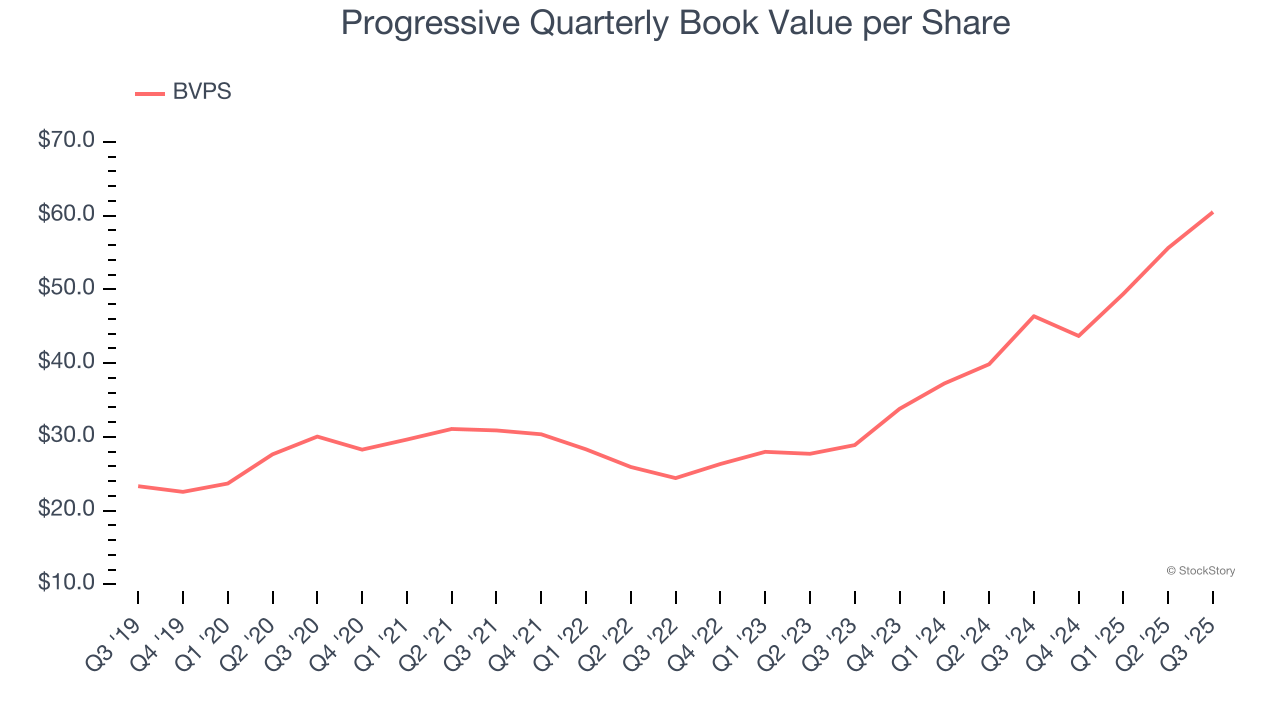
3. Growing BVPS Reflects Strong Asset Base
For insurers, book value per share (BVPS) is a vital measure of financial health, representing the total assets available to shareholders after accounting for all liabilities, including policyholder reserves and claims obligations.
Progressive’s BVPS increased by 15% annually over the last five years, and growth has recently accelerated as BVPS grew at an incredible 44.7% annual clip over the past two years (from $28.89 to $60.49 per share).
Final Judgment
These are just a few reasons why we think Progressive is an elite insurance company. With the recent decline, the stock trades at 3.6× forward P/B (or $223.29 per share). Is now a good time to initiate a position? See for yourself in our comprehensive research report, it’s free for active Edge members .
High-Quality Stocks for All Market Conditions
The market’s up big this year - but there’s a catch. Just 4 stocks account for half the S&P 500’s entire gain. That kind of concentration makes investors nervous, and for good reason. While everyone piles into the same crowded names, smart investors are hunting quality where no one’s looking - and paying a fraction of the price. Check out the high-quality names we’ve flagged in our Top 5 Growth Stocks for this month. This is a curated list of our High Quality stocks that have generated a market-beating return of 244% over the last five years (as of June 30, 2025).
Stocks that have made our list include now familiar names such as Nvidia (+1,326% between June 2020 and June 2025) as well as under-the-radar businesses like the once-small-cap company Exlservice (+354% five-year return). Find your next big winner with StockStory today.
StockStory is growing and hiring equity analyst and marketing roles. Are you a 0 to 1 builder passionate about the markets and AI? See the open roles here.


