Landscaping service company BrightView (NYSE: BV) fell short of the markets revenue expectations in Q3 CY2025, with sales falling 3.6% year on year to $702.8 million. The company’s full-year revenue guidance of $2.7 billion at the midpoint came in 1.7% below analysts’ estimates. Its non-GAAP profit of $0.27 per share was 14.7% below analysts’ consensus estimates.
Is now the time to buy BrightView? Find out by accessing our full research report, it’s free for active Edge members.
BrightView (BV) Q3 CY2025 Highlights:
- Revenue: $702.8 million vs analyst estimates of $722.9 million (3.6% year-on-year decline, 2.8% miss)
- Adjusted EPS: $0.27 vs analyst expectations of $0.32 (14.7% miss)
- Adjusted EBITDA: $113.5 million vs analyst estimates of $113.3 million (16.1% margin, in line)
- EBITDA guidance for the upcoming financial year 2026 is $370 million at the midpoint, below analyst estimates of $375.8 million
- Operating Margin: 7.9%, in line with the same quarter last year
- Free Cash Flow Margin: 12%, up from 3.4% in the same quarter last year
- Market Capitalization: $1.13 billion
“Our fourth quarter and full-year results reflect the continued momentum behind our One BrightView strategy and the strengthened foundation of our business,” said Dale Asplund, BrightView President and Chief Executive Officer.
Company Overview
An official field consultant for Major League Baseball, BrightView (NYSE: BV) offers landscaping design, development, and maintenance.
Revenue Growth
Examining a company’s long-term performance can provide clues about its quality. Even a bad business can shine for one or two quarters, but a top-tier one grows for years. Unfortunately, BrightView’s 2.6% annualized revenue growth over the last five years was sluggish. This fell short of our benchmarks and is a rough starting point for our analysis.
We at StockStory place the most emphasis on long-term growth, but within industrials, a half-decade historical view may miss cycles, industry trends, or a company capitalizing on catalysts such as a new contract win or a successful product line. BrightView’s performance shows it grew in the past but relinquished its gains over the last two years, as its revenue fell by 2.6% annually. 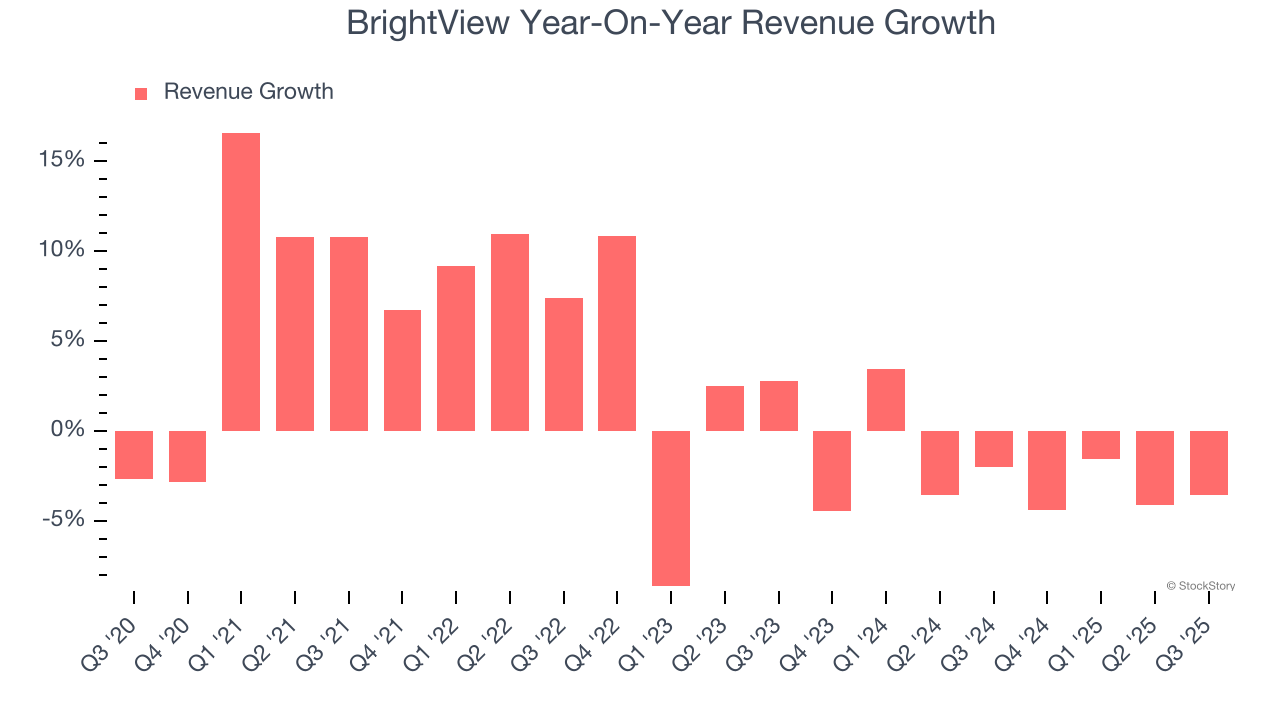
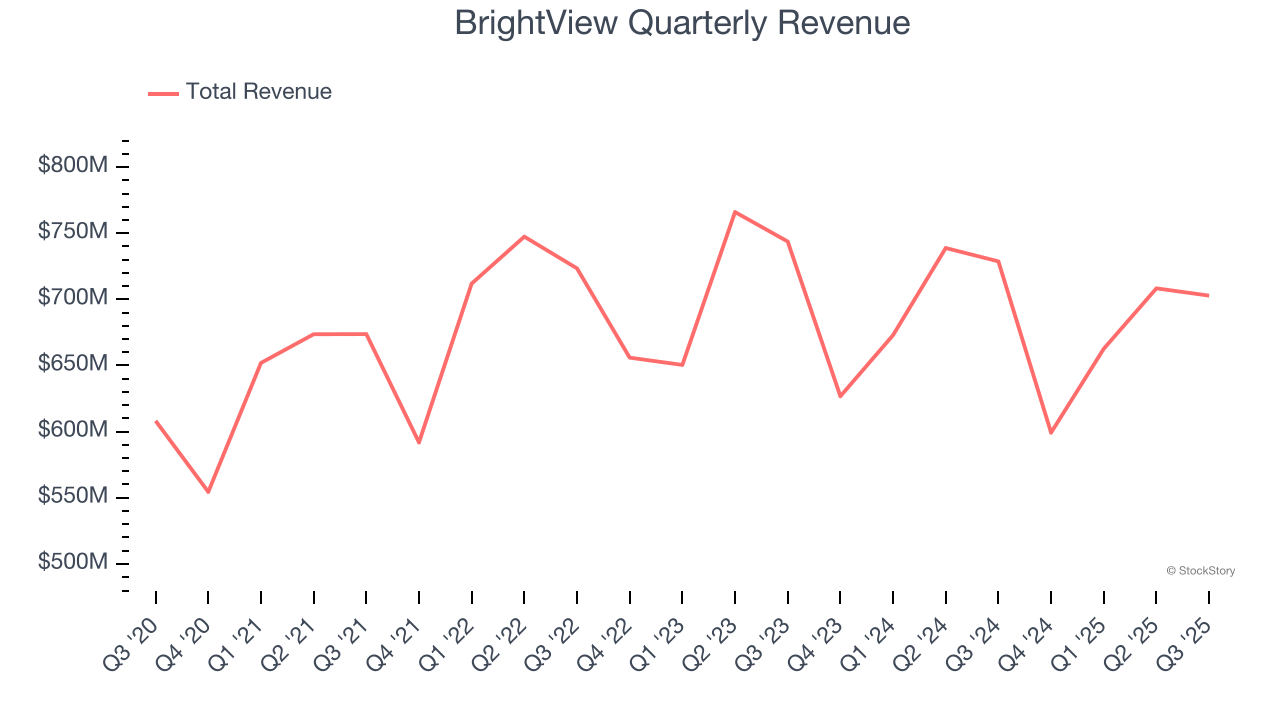
This quarter, BrightView missed Wall Street’s estimates and reported a rather uninspiring 3.6% year-on-year revenue decline, generating $702.8 million of revenue.
Looking ahead, sell-side analysts expect revenue to grow 3% over the next 12 months. While this projection indicates its newer products and services will catalyze better top-line performance, it is still below average for the sector.
While Wall Street chases Nvidia at all-time highs, an under-the-radar semiconductor supplier is dominating a critical AI component these giants can’t build without. Click here to access our free report one of our favorites growth stories.
Operating Margin
Operating margin is a key measure of profitability. Think of it as net income - the bottom line - excluding the impact of taxes and interest on debt, which are less connected to business fundamentals.
BrightView was profitable over the last five years but held back by its large cost base. Its average operating margin of 4.2% was weak for an industrials business. This result isn’t too surprising given its low gross margin as a starting point.
On the plus side, BrightView’s operating margin rose by 1.5 percentage points over the last five years, as its sales growth gave it operating leverage.
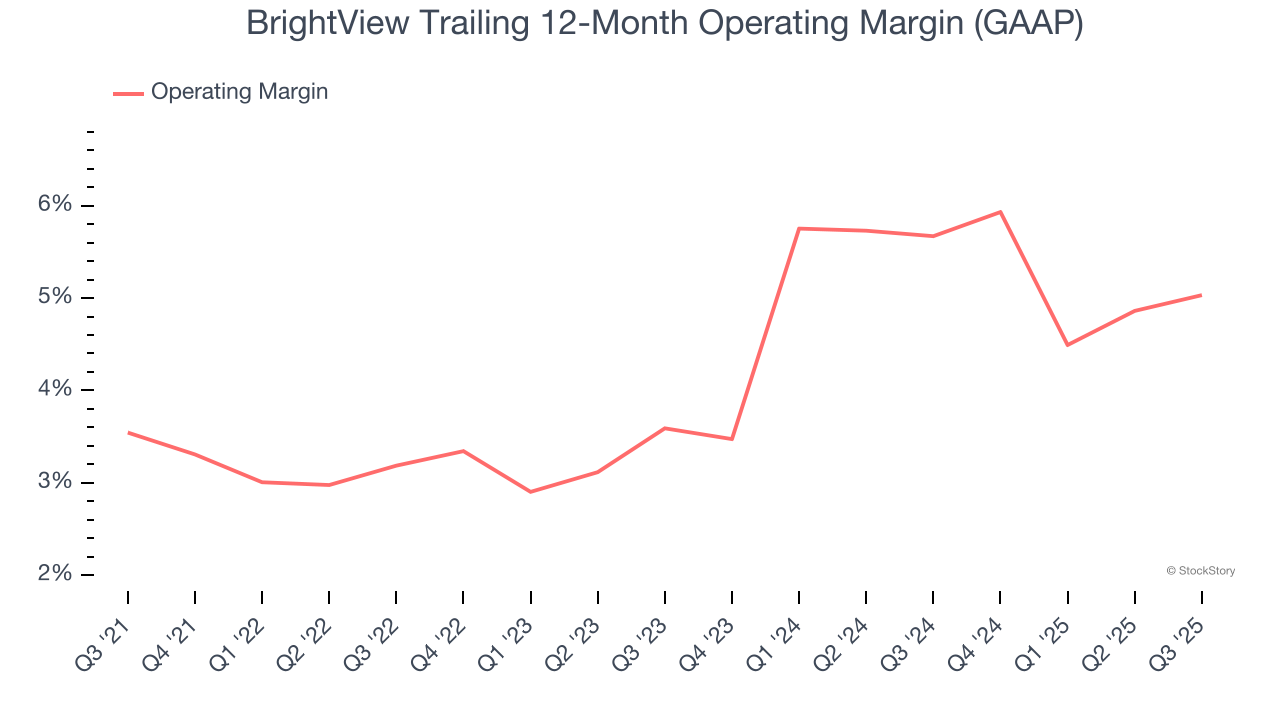
This quarter, BrightView generated an operating margin profit margin of 7.9%, in line with the same quarter last year. This indicates the company’s cost structure has recently been stable.
Earnings Per Share
We track the long-term change in earnings per share (EPS) for the same reason as long-term revenue growth. Compared to revenue, however, EPS highlights whether a company’s growth is profitable.
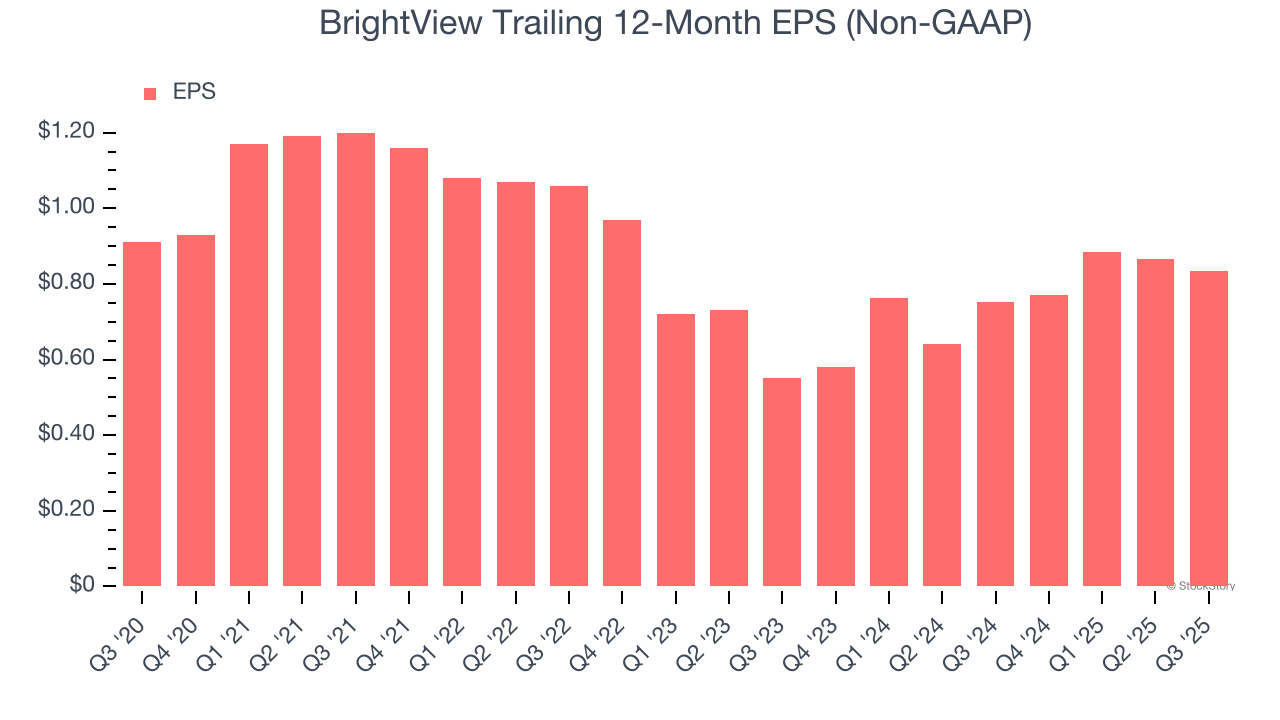
Sadly for BrightView, its EPS declined by 1.7% annually over the last five years while its revenue grew by 2.6%. We can see the difference stemmed from higher interest expenses or taxes as the company actually improved its operating margin and repurchased its shares during this time.
Like with revenue, we analyze EPS over a shorter period to see if we are missing a change in the business.
For BrightView, its two-year annual EPS growth of 23.2% was higher than its five-year trend. This acceleration made it one of the faster-growing industrials companies in recent history.
In Q3, BrightView reported adjusted EPS of $0.27, down from $0.30 in the same quarter last year. This print missed analysts’ estimates. Over the next 12 months, Wall Street expects BrightView’s full-year EPS of $0.84 to grow 1.5%.
Key Takeaways from BrightView’s Q3 Results
We struggled to find many positives in these results. Its revenue missed and its EPS fell short of Wall Street’s estimates. Overall, this was a softer quarter. The stock traded down 16.7% to $9.87 immediately after reporting.
BrightView underperformed this quarter, but does that create an opportunity to invest right now? If you’re making that decision, you should consider the bigger picture of valuation, business qualities, as well as the latest earnings. We cover that in our actionable full research report which you can read here, it’s free for active Edge members.