Perma-Fix has followed the market’s trajectory closely, rising in tandem with the S&P 500 over the past six months. The stock has climbed by 10.8% to $11.25 per share while the index has gained 13.7%.
Is now the time to buy Perma-Fix, or should you be careful about including it in your portfolio? Check out our in-depth research report to see what our analysts have to say, it’s free for active Edge members.
Why Do We Think Perma-Fix Will Underperform?
We're sitting this one out for now. Here are three reasons you should be careful with PESI and a stock we'd rather own.
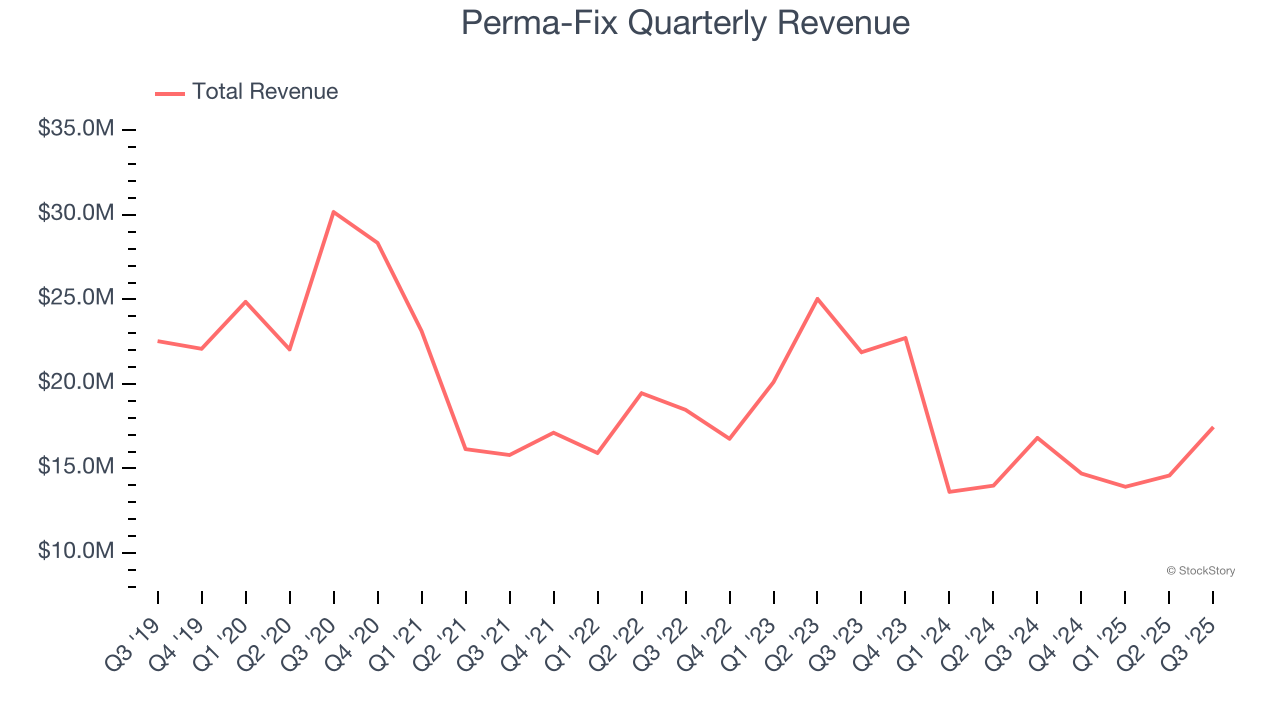
1. Revenue Spiraling Downwards
A company’s long-term performance is an indicator of its overall quality. Any business can experience short-term success, but top-performing ones enjoy sustained growth for years. Over the last five years, Perma-Fix’s demand was weak and its revenue declined by 9.4% per year. This wasn’t a great result and signals it’s a low quality business.
2. New Investments Fail to Bear Fruit as ROIC Declines
A company’s ROIC, or return on invested capital, shows how much operating profit it makes compared to the money it has raised (debt and equity).
We like to invest in businesses with high returns, but the trend in a company’s ROIC is what often surprises the market and moves the stock price. Over the last few years, Perma-Fix’s ROIC has unfortunately decreased significantly. Paired with its already low returns, these declines suggest its profitable growth opportunities are few and far between.
3. Short Cash Runway Exposes Shareholders to Potential Dilution
As long-term investors, the risk we care about most is the permanent loss of capital, which can happen when a company goes bankrupt or raises money from a disadvantaged position. This is separate from short-term stock price volatility, something we are much less bothered by.
Perma-Fix burned through $15.72 million of cash over the last year. With $29.5 million of cash on its balance sheet, the company has around 23 months of runway left (assuming its $1.95 million of debt isn’t due right away).
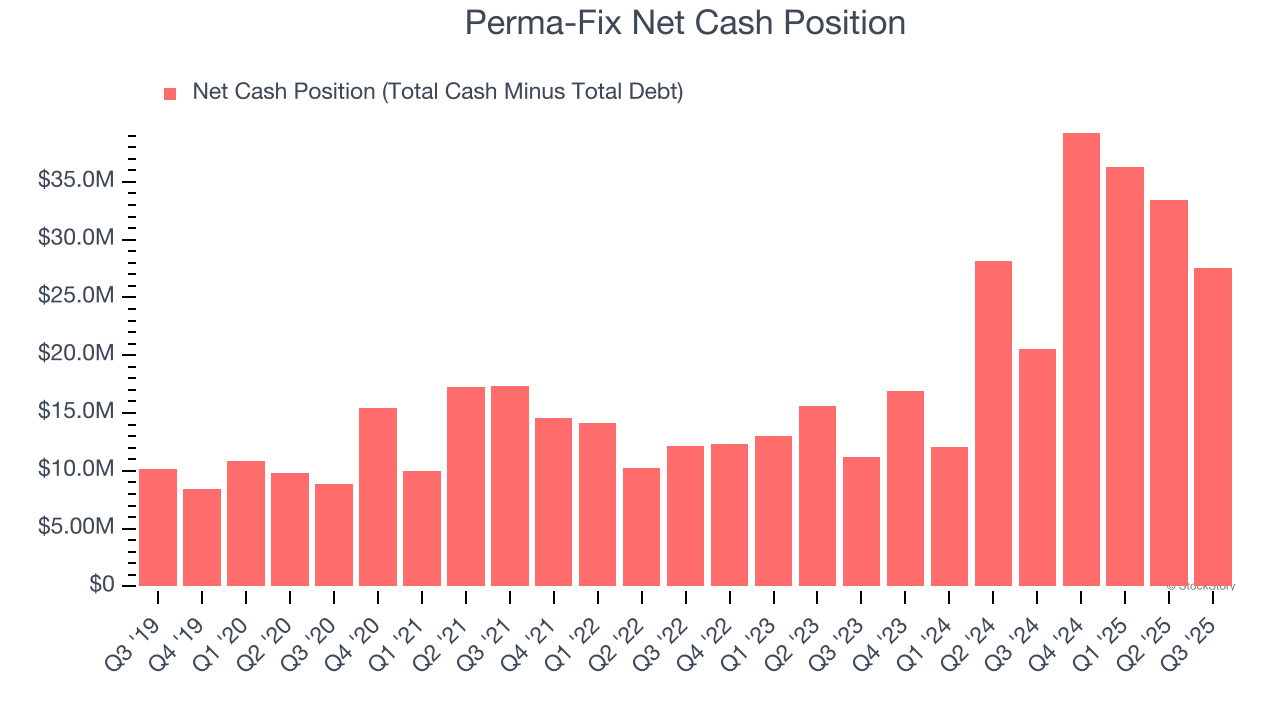
Unless the Perma-Fix’s fundamentals change quickly, it might find itself in a position where it must raise capital from investors to continue operating. Whether that would be favorable is unclear because dilution is a headwind for shareholder returns.
We remain cautious of Perma-Fix until it generates consistent free cash flow or any of its announced financing plans materialize on its balance sheet.
Final Judgment
Perma-Fix doesn’t pass our quality test. That said, the stock currently trades at 405× forward P/E (or $11.25 per share). This valuation tells us a lot of optimism is priced in - we think there are better opportunities elsewhere. We’d suggest looking at one of our all-time favorite software stocks.
Stocks We Would Buy Instead of Perma-Fix
If your portfolio success hinges on just 4 stocks, your wealth is built on fragile ground. You have a small window to secure high-quality assets before the market widens and these prices disappear.
Don’t wait for the next volatility shock. Check out our Top 6 Stocks for this week. This is a curated list of our High Quality stocks that have generated a market-beating return of 244% over the last five years (as of June 30, 2025).
Stocks that have made our list include now familiar names such as Nvidia (+1,326% between June 2020 and June 2025) as well as under-the-radar businesses like the once-small-cap company Comfort Systems (+782% five-year return). Find your next big winner with StockStory today.
StockStory is growing and hiring equity analyst and marketing roles. Are you a 0 to 1 builder passionate about the markets and AI? See the open roles here.