
As the Q3 earnings season wraps, let’s dig into this quarter’s best and worst performers in the sit-down dining industry, including Darden (NYSE: DRI) and its peers.
Sit-down restaurants offer a complete dining experience with table service. These establishments span various cuisines and are renowned for their warm hospitality and welcoming ambiance, making them perfect for family gatherings, special occasions, or simply unwinding. Their extensive menus range from appetizers to indulgent desserts and wines and cocktails. This space is extremely fragmented and competition includes everything from publicly-traded companies owning multiple chains to single-location mom-and-pop restaurants.
The 12 sit-down dining stocks we track reported a mixed Q3. As a group, revenues were in line with analysts’ consensus estimates.
Thankfully, share prices of the companies have been resilient as they are up 7.9% on average since the latest earnings results.
Darden (NYSE: DRI)
Founded in 1968 as Red Lobster, Darden (NYSE: DRI) is a leading American restaurant company that owns and operates a portfolio of popular restaurant brands.
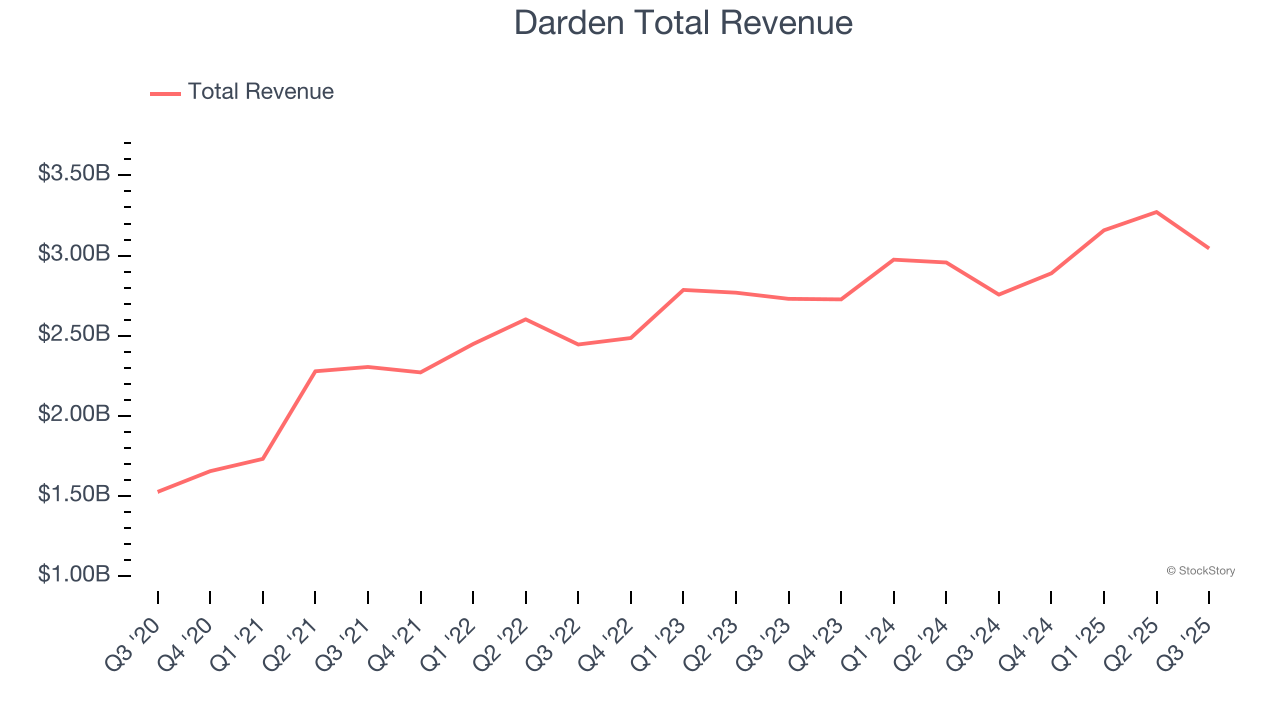
Darden reported revenues of $3.04 billion, up 10.4% year on year. This print was in line with analysts’ expectations, but overall, it was a slower quarter for the company with a miss of analysts’ EBITDA estimates and full-year EPS guidance slightly missing analysts’ expectations.
"We had a strong start to the fiscal year with same-restaurant sales and earnings growth that exceeded our expectations," said Darden President & CEO Rick Cardenas.
Unsurprisingly, the stock is down 14.1% since reporting and currently trades at $179.25.
Read our full report on Darden here, it’s free for active Edge members.
Best Q3: Bloomin' Brands (NASDAQ: BLMN)
Owner of the iconic Australian-themed Outback Steakhouse, Bloomin’ Brands (NASDAQ: BLMN) is a leading American restaurant company that owns and operates a portfolio of popular restaurant brands.
Bloomin' Brands reported revenues of $928.8 million, down 10.6% year on year, outperforming analysts’ expectations by 2.7%. The business had a stunning quarter with a beat of analysts’ EPS estimates and a solid beat of analysts’ EBITDA estimates.

Although it had a fine quarter compared its peers, the market seems unhappy with the results as the stock is down 4.6% since reporting. It currently trades at $6.90.
Is now the time to buy Bloomin' Brands? Access our full analysis of the earnings results here, it’s free for active Edge members.
Slowest Q3: Denny's (NASDAQ: DENN)
Open around the clock, Denny’s (NASDAQ: DENN) is a chain of diner restaurants serving breakfast and traditional American fare.
Denny's reported revenues of $113.2 million, up 1.3% year on year, falling short of analysts’ expectations by 3.2%. It was a disappointing quarter as it posted a significant miss of analysts’ revenue estimates and a miss of analysts’ EBITDA estimates.
Interestingly, the stock is up 50.4% since the results and currently trades at $6.18.
Read our full analysis of Denny’s results here.
Red Robin (NASDAQ: RRGB)
Known for its bottomless steak fries, Red Robin (NASDAQ: RRGB) is a chain of casual restaurants specializing in burgers and general American fare.
Red Robin reported revenues of $265.1 million, down 3.5% year on year. This result beat analysts’ expectations by 3.3%. It was a very strong quarter as it also produced a solid beat of analysts’ EBITDA estimates and an impressive beat of analysts’ revenue estimates.
Red Robin achieved the biggest analyst estimates beat among its peers. The stock is down 11.5% since reporting and currently trades at $4.16.
Read our full, actionable report on Red Robin here, it’s free for active Edge members.
BJ's (NASDAQ: BJRI)
Founded in 1978 in California, BJ’s Restaurants (NASDAQ: BJRI) is a chain of restaurants whose menu features classic American dishes, often with a twist.
BJ's reported revenues of $330.2 million, up 1.4% year on year. This number came in 1.1% below analysts' expectations. Zooming out, it was a mixed quarter as it also produced a beat of analysts’ EPS estimates but a slight miss of analysts’ revenue estimates.
The stock is up 33.2% since reporting and currently trades at $38.23.
Read our full, actionable report on BJ's here, it’s free for active Edge members.
Market Update
As a result of the Fed’s rate hikes in 2022 and 2023, inflation has come down from frothy levels post-pandemic. The general rise in the price of goods and services is trending towards the Fed’s 2% goal as of late, which is good news. The higher rates that fought inflation also didn't slow economic activity enough to catalyze a recession. So far, soft landing. This, combined with recent rate cuts (half a percent in September 2024 and a quarter percent in November 2024) have led to strong stock market performance in 2024. The icing on the cake for 2024 returns was Donald Trump’s victory in the U.S. Presidential Election in early November, sending major indices to all-time highs in the week following the election. Still, debates around the health of the economy and the impact of potential tariffs and corporate tax cuts remain, leaving much uncertainty around 2025.
Want to invest in winners with rock-solid fundamentals? Check out our Strong Momentum Stocks and add them to your watchlist. These companies are poised for growth regardless of the political or macroeconomic climate.
StockStory’s analyst team — all seasoned professional investors — uses quantitative analysis and automation to deliver market-beating insights faster and with higher quality.


