
Modular home and building manufacturer Champion Homes (NYSE: SKY) beat Wall Street’s revenue expectations in Q3 CY2025, with sales up 11% year on year to $684.4 million. Its non-GAAP profit of $1.01 per share was 23.1% above analysts’ consensus estimates.
Is now the time to buy Champion Homes? Find out by accessing our full research report, it’s free for active Edge members.
Champion Homes (SKY) Q3 CY2025 Highlights:
- Revenue: $684.4 million vs analyst estimates of $640.2 million (11% year-on-year growth, 6.9% beat)
- Adjusted EPS: $1.01 vs analyst estimates of $0.82 (23.1% beat)
- Adjusted EBITDA: $83.35 million vs analyst estimates of $66.43 million (12.2% margin, 25.5% beat)
- Operating Margin: 10.9%, in line with the same quarter last year
- Free Cash Flow Margin: 9.8%, up from 7.4% in the same quarter last year
- Sales Volumes rose 3.4% year on year (31.3% in the same quarter last year)
- Market Capitalization: $3.76 billion
Company Overview
Founded in 1951, Champion Homes (NYSE: SKY) is a manufacturer of modular homes and buildings in North America.
Revenue Growth
A company’s long-term sales performance is one signal of its overall quality. Even a bad business can shine for one or two quarters, but a top-tier one grows for years. Thankfully, Champion Homes’s 16.2% annualized revenue growth over the last five years was incredible. Its growth beat the average industrials company and shows its offerings resonate with customers.
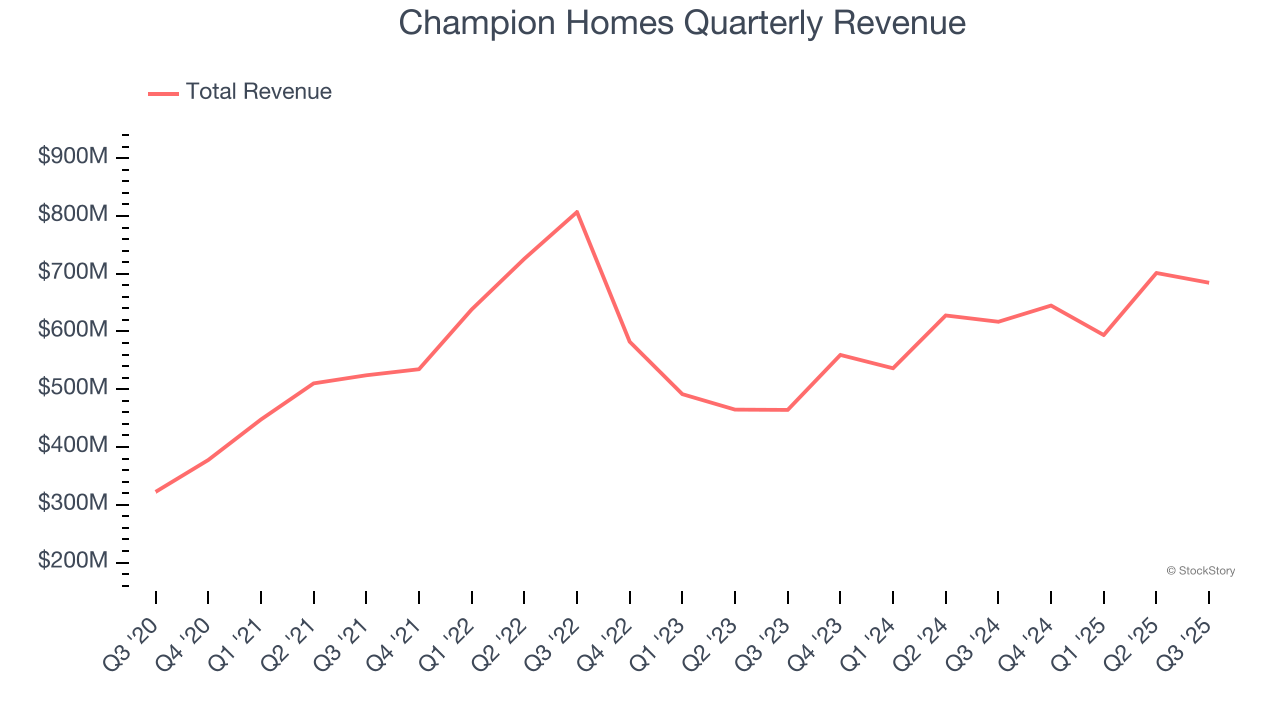
We at StockStory place the most emphasis on long-term growth, but within industrials, a half-decade historical view may miss cycles, industry trends, or a company capitalizing on catalysts such as a new contract win or a successful product line. Champion Homes’s annualized revenue growth of 14.5% over the last two years is below its five-year trend, but we still think the results suggest healthy demand. 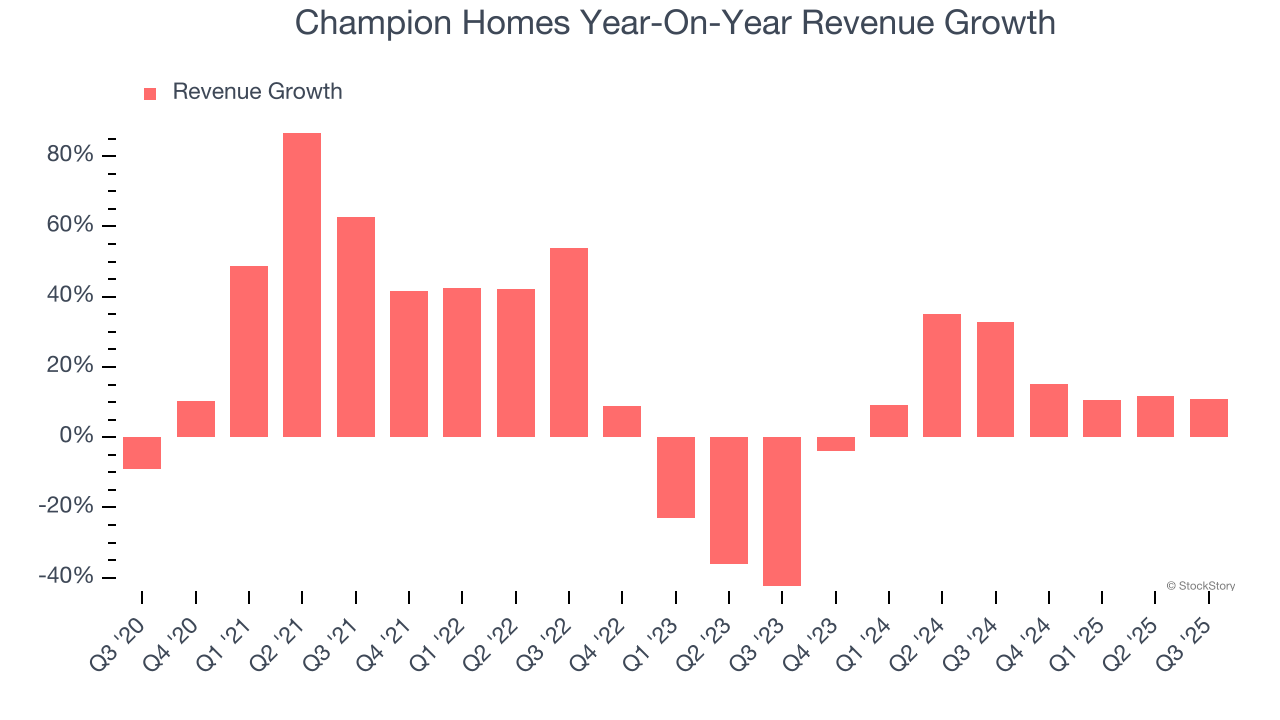
We can dig further into the company’s revenue dynamics by analyzing its number of units sold, which reached 6,575 in the latest quarter. Over the last two years, Champion Homes’s units sold averaged 13.7% year-on-year growth. Because this number is in line with its revenue growth, we can see the company kept its prices fairly consistent. 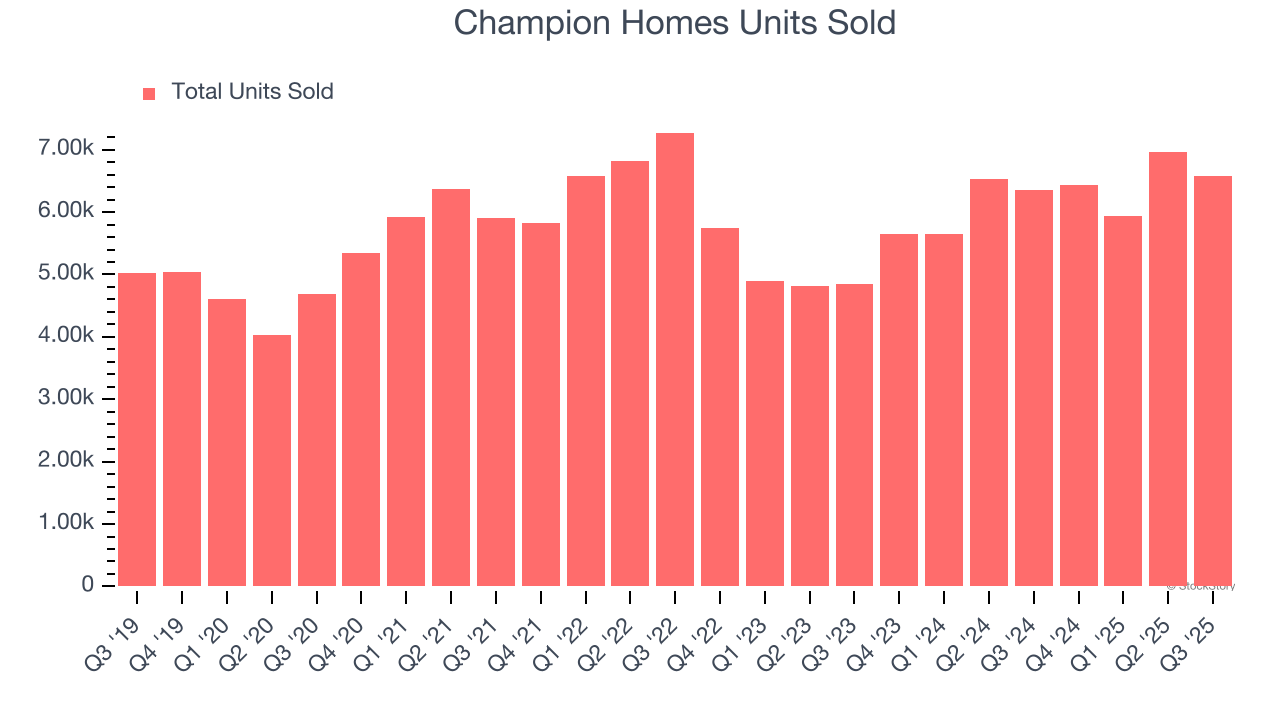
This quarter, Champion Homes reported year-on-year revenue growth of 11%, and its $684.4 million of revenue exceeded Wall Street’s estimates by 6.9%.
Looking ahead, sell-side analysts expect revenue to remain flat over the next 12 months, a deceleration versus the last two years. This projection doesn't excite us and implies its products and services will see some demand headwinds.
Software is eating the world and there is virtually no industry left that has been untouched by it. That drives increasing demand for tools helping software developers do their jobs, whether it be monitoring critical cloud infrastructure, integrating audio and video functionality, or ensuring smooth content streaming. Click here to access a free report on our 3 favorite stocks to play this generational megatrend.
Operating Margin
Champion Homes’s operating margin has been trending up over the last 12 months and averaged 12.9% over the last five years. On top of that, its profitability was top-notch for an industrials business, showing it’s an well-run company with an efficient cost structure. This result was particularly impressive because of its low gross margin, which is mostly a factor of what it sells and takes huge shifts to move meaningfully. Companies have more control over their operating margins, and it’s a show of well-managed operations if they’re high when gross margins are low.
Analyzing the trend in its profitability, Champion Homes’s operating margin might fluctuated slightly but has generally stayed the same over the last five years. We like to see margin expansion, but we’re still happy with Champion Homes’s performance considering most Home Builders companies saw their margins plummet.
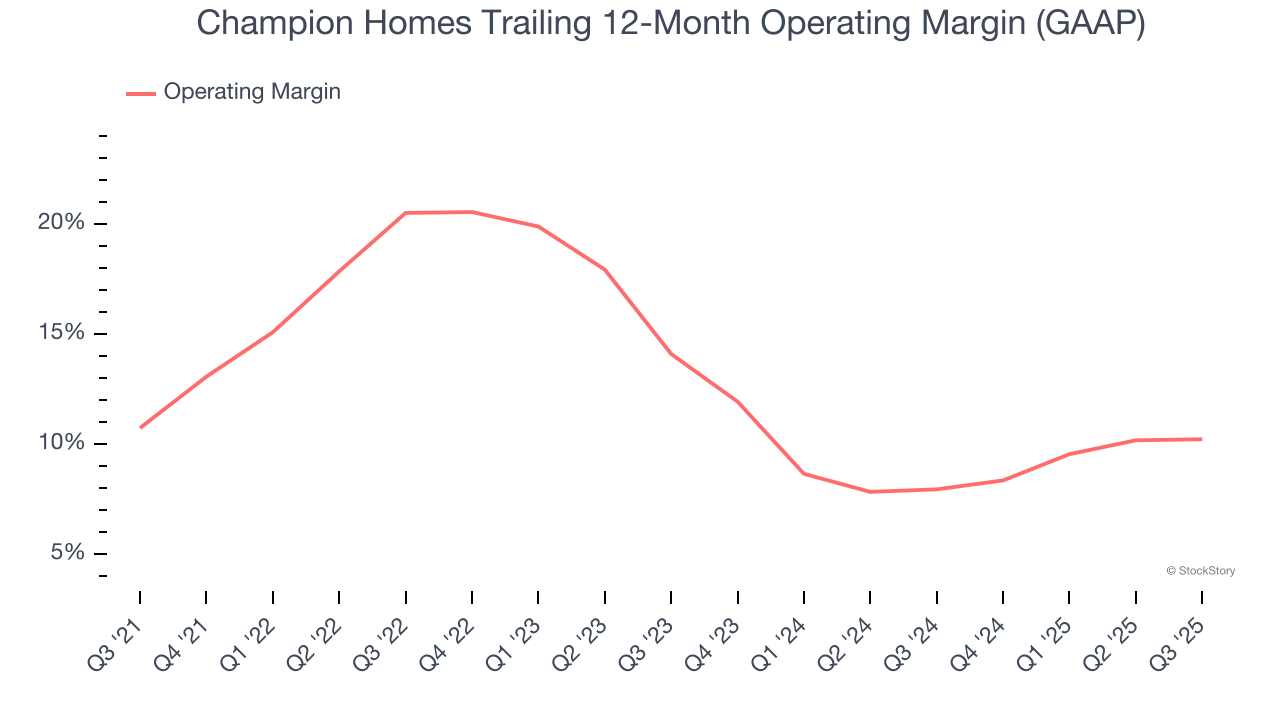
In Q3, Champion Homes generated an operating margin profit margin of 10.9%, in line with the same quarter last year. This indicates the company’s cost structure has recently been stable.
Earnings Per Share
We track the long-term change in earnings per share (EPS) for the same reason as long-term revenue growth. Compared to revenue, however, EPS highlights whether a company’s growth is profitable.
Champion Homes’s EPS grew at an astounding 31.5% compounded annual growth rate over the last five years, higher than its 16.2% annualized revenue growth. This tells us the company became more profitable on a per-share basis as it expanded.
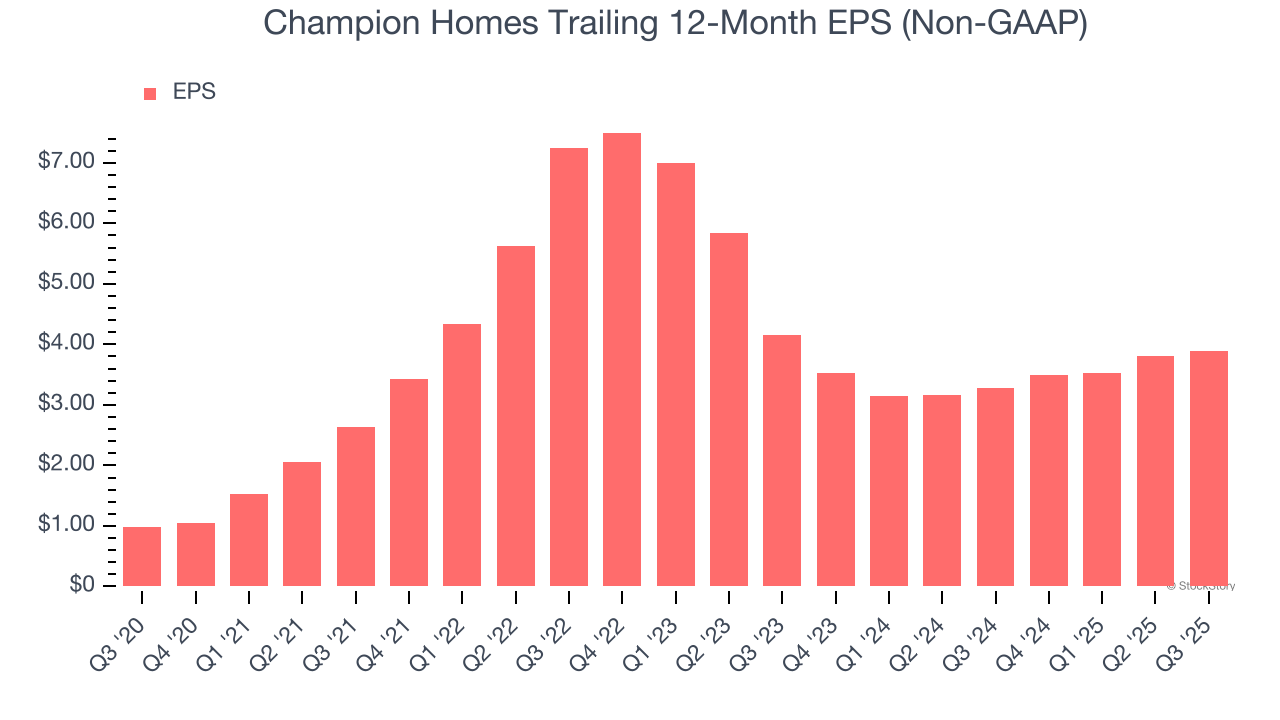
Like with revenue, we analyze EPS over a more recent period because it can provide insight into an emerging theme or development for the business.
For Champion Homes, its two-year annual EPS declines of 3.2% mark a reversal from its (seemingly) healthy five-year trend. We hope Champion Homes can return to earnings growth in the future.
In Q3, Champion Homes reported adjusted EPS of $1.01, up from $0.93 in the same quarter last year. This print easily cleared analysts’ estimates, and shareholders should be content with the results. Over the next 12 months, Wall Street expects Champion Homes’s full-year EPS of $3.89 to shrink by 10%.
Key Takeaways from Champion Homes’s Q3 Results
We were impressed by how significantly Champion Homes blew past analysts’ revenue, EPS, and EBITDA expectations this quarter. Zooming out, we think this was a good print with some key areas of upside. The stock traded up 5.1% to $70.01 immediately following the results.
Champion Homes had an encouraging quarter, but one earnings result doesn’t necessarily make the stock a buy. Let’s see if this is a good investment. The latest quarter does matter, but not nearly as much as longer-term fundamentals and valuation, when deciding if the stock is a buy. We cover that in our actionable full research report which you can read here, it’s free for active Edge members.


