Live events and entertainment company Live Nation (NYSE: LYV) fell short of the markets revenue expectations in Q3 CY2025, but sales rose 11.1% year on year to $8.50 billion. Its GAAP profit of $0.73 per share was 44.7% below analysts’ consensus estimates.
Is now the time to buy Live Nation? Find out by accessing our full research report, it’s free for active Edge members.
Live Nation (LYV) Q3 CY2025 Highlights:
- Revenue: $8.50 billion vs analyst estimates of $8.59 billion (11.1% year-on-year growth, 1% miss)
- EPS (GAAP): $0.73 vs analyst expectations of $1.32 (44.7% miss)
- Adjusted EBITDA: $958.1 million vs analyst estimates of $1.03 billion (11.3% margin, 7.4% miss)
- Operating Margin: 9.3%, in line with the same quarter last year
- Free Cash Flow Margin: 8.4%, down from 9.4% in the same quarter last year
- Market Capitalization: $34.76 billion
Company Overview
Owner of Ticketmaster and operator of music festival EDC, Live Nation (NYSE: LYV) is a company specializing in live event promotion, venue management, and ticketing services for concerts and shows.
Revenue Growth
Examining a company’s long-term performance can provide clues about its quality. Any business can put up a good quarter or two, but many enduring ones grow for years. Thankfully, Live Nation’s 40.3% annualized revenue growth over the last five years was incredible. Its growth beat the average consumer discretionary company and shows its offerings resonate with customers.
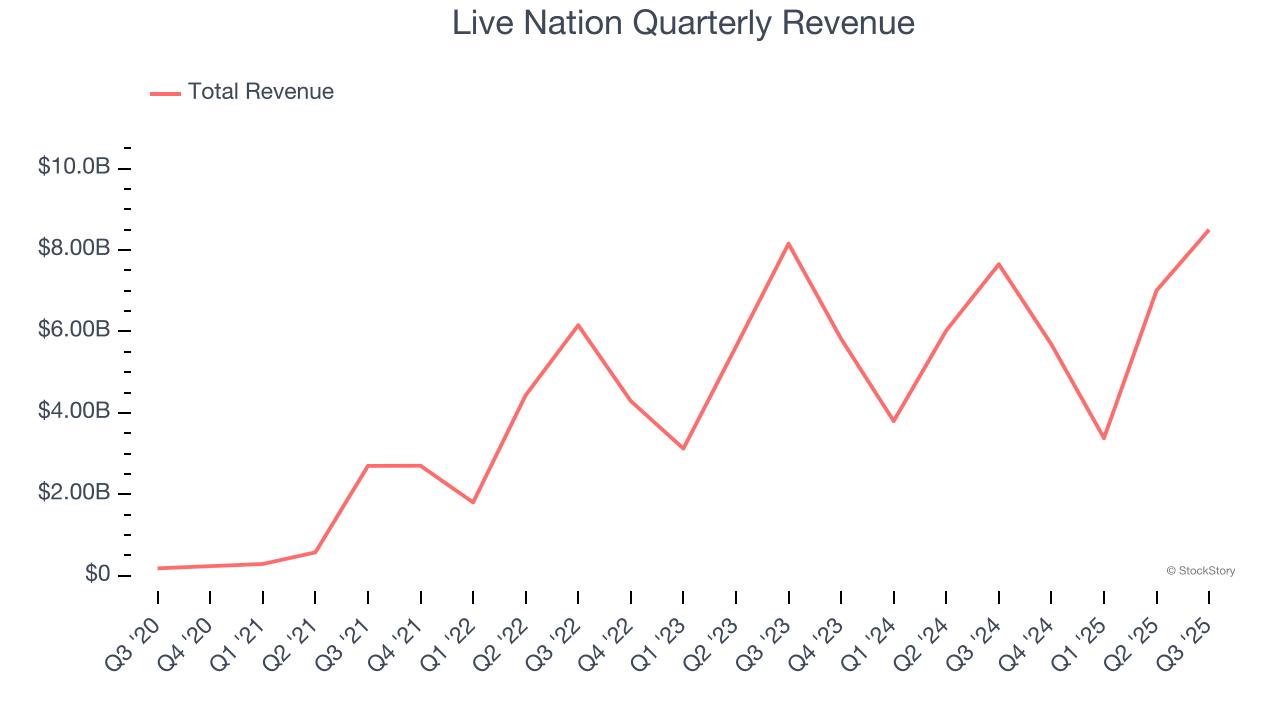
Long-term growth is the most important, but within consumer discretionary, product cycles are short and revenue can be hit-driven due to rapidly changing trends and consumer preferences. Live Nation’s recent performance shows its demand has slowed significantly as its annualized revenue growth of 7.7% over the last two years was well below its five-year trend. Note that COVID hurt Live Nation’s business in 2020 and part of 2021, and it bounced back in a big way thereafter. 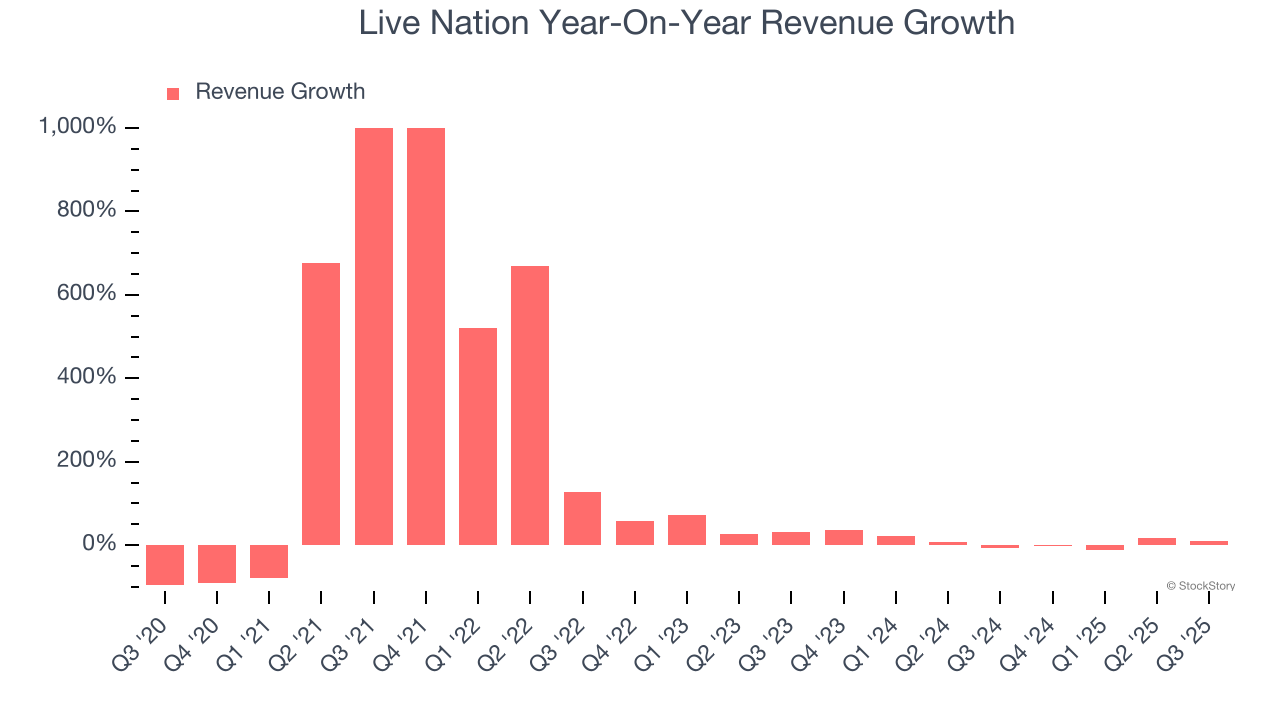
This quarter, Live Nation’s revenue grew by 11.1% year on year to $8.50 billion but fell short of Wall Street’s estimates.
Looking ahead, sell-side analysts expect revenue to grow 10.8% over the next 12 months. While this projection implies its newer products and services will fuel better top-line performance, it is still below the sector average.
Software is eating the world and there is virtually no industry left that has been untouched by it. That drives increasing demand for tools helping software developers do their jobs, whether it be monitoring critical cloud infrastructure, integrating audio and video functionality, or ensuring smooth content streaming. Click here to access a free report on our 3 favorite stocks to play this generational megatrend.
Operating Margin
Operating margin is a key measure of profitability. Think of it as net income - the bottom line - excluding the impact of taxes and interest on debt, which are less connected to business fundamentals.
Live Nation’s operating margin might fluctuated slightly over the last 12 months but has generally stayed the same, averaging 4.5% over the last two years. This profitability was lousy for a consumer discretionary business and caused by its suboptimal cost structure.
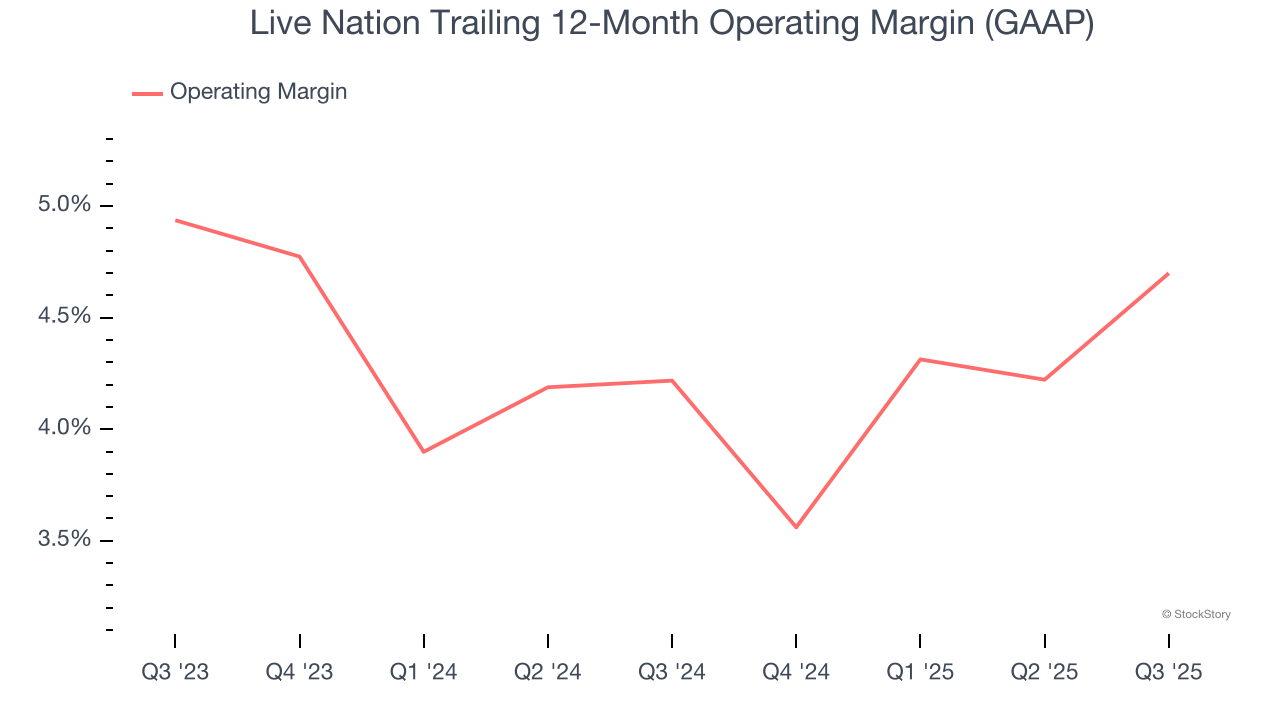
This quarter, Live Nation generated an operating margin profit margin of 9.3%, in line with the same quarter last year. This indicates the company’s overall cost structure has been relatively stable.
Earnings Per Share
We track the long-term change in earnings per share (EPS) for the same reason as long-term revenue growth. Compared to revenue, however, EPS highlights whether a company’s growth is profitable.
Live Nation’s full-year EPS flipped from negative to positive over the last five years. This is a good sign and shows it’s at an inflection point.
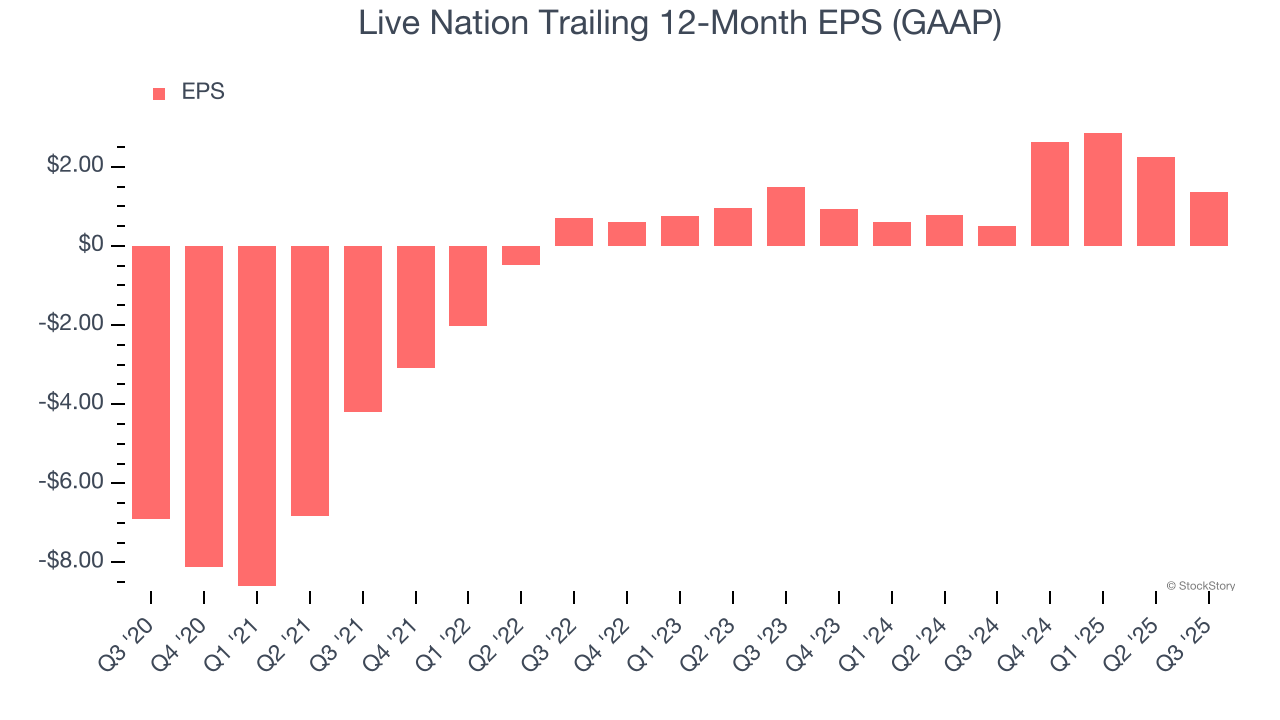
In Q3, Live Nation reported EPS of $0.73, down from $1.62 in the same quarter last year. This print missed analysts’ estimates, but we care more about long-term EPS growth than short-term movements. Over the next 12 months, Wall Street expects Live Nation’s full-year EPS of $1.35 to grow 104%.
Key Takeaways from Live Nation’s Q3 Results
We were impressed by how significantly Live Nation blew past analysts’ adjusted operating income expectations this quarter. On the other hand, its EPS missed and its EBITDA fell short of Wall Street’s estimates. Overall, this was a softer quarter. The stock traded down 5.6% to $142.37 immediately following the results.
Live Nation’s latest earnings report disappointed. One quarter doesn’t define a company’s quality, so let’s explore whether the stock is a buy at the current price. The latest quarter does matter, but not nearly as much as longer-term fundamentals and valuation, when deciding if the stock is a buy. We cover that in our actionable full research report which you can read here, it’s free for active Edge members.