
Integrated packaging solutions provider Sealed Air Corporation (NYSE: SEE) announced better-than-expected revenue in Q3 CY2025, but sales were flat year on year at $1.35 billion. The company expects the full year’s revenue to be around $5.3 billion, close to analysts’ estimates. Its non-GAAP profit of $0.87 per share was 24.9% above analysts’ consensus estimates.
Is now the time to buy Sealed Air? Find out by accessing our full research report, it’s free for active Edge members.
Sealed Air (SEE) Q3 CY2025 Highlights:
- Revenue: $1.35 billion vs analyst estimates of $1.32 billion (flat year on year, 2.7% beat)
- Adjusted EPS: $0.87 vs analyst estimates of $0.70 (24.9% beat)
- Adjusted EBITDA: $287.5 million vs analyst estimates of $270.5 million (21.3% margin, 6.3% beat)
- The company reconfirmed its revenue guidance for the full year of $5.3 billion at the midpoint
- Management raised its full-year Adjusted EPS guidance to $3.30 at the midpoint, a 6.5% increase
- EBITDA guidance for the full year is $1.13 billion at the midpoint, above analyst estimates of $1.12 billion
- Operating Margin: 13.7%, in line with the same quarter last year
- Free Cash Flow Margin: 8.9%, similar to the same quarter last year
- Market Capitalization: $5.00 billion
"Our third quarter performance reflects our ability to control the controllables against a challenging market backdrop. We made further progress on our transformation, which drove a positive inflection in Protective's material volumes for the first time since 2021. We remain laser focused on putting our customers first, executing with urgency and maximizing shareholder value," said Dustin Semach, Sealed Air's President and CEO.
Company Overview
Founded in 1960, Sealed Air Corporation (NYSE: SEE) specializes in the development and production of protective and food packaging solutions, serving a variety of industries.
Revenue Growth
A company’s long-term performance is an indicator of its overall quality. Any business can put up a good quarter or two, but many enduring ones grow for years. Over the last five years, Sealed Air grew its sales at a sluggish 1.9% compounded annual growth rate. This fell short of our benchmarks and is a rough starting point for our analysis.
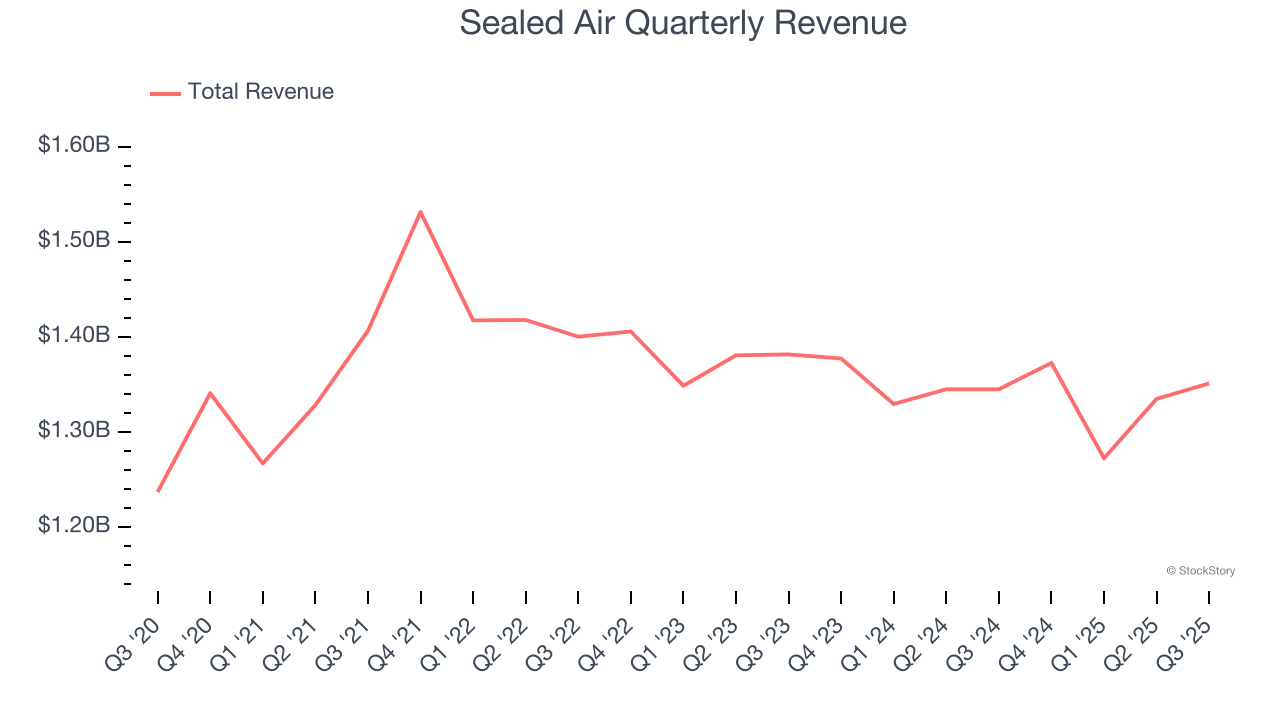
Long-term growth is the most important, but within industrials, a half-decade historical view may miss new industry trends or demand cycles. Sealed Air’s performance shows it grew in the past but relinquished its gains over the last two years, as its revenue fell by 1.7% annually. 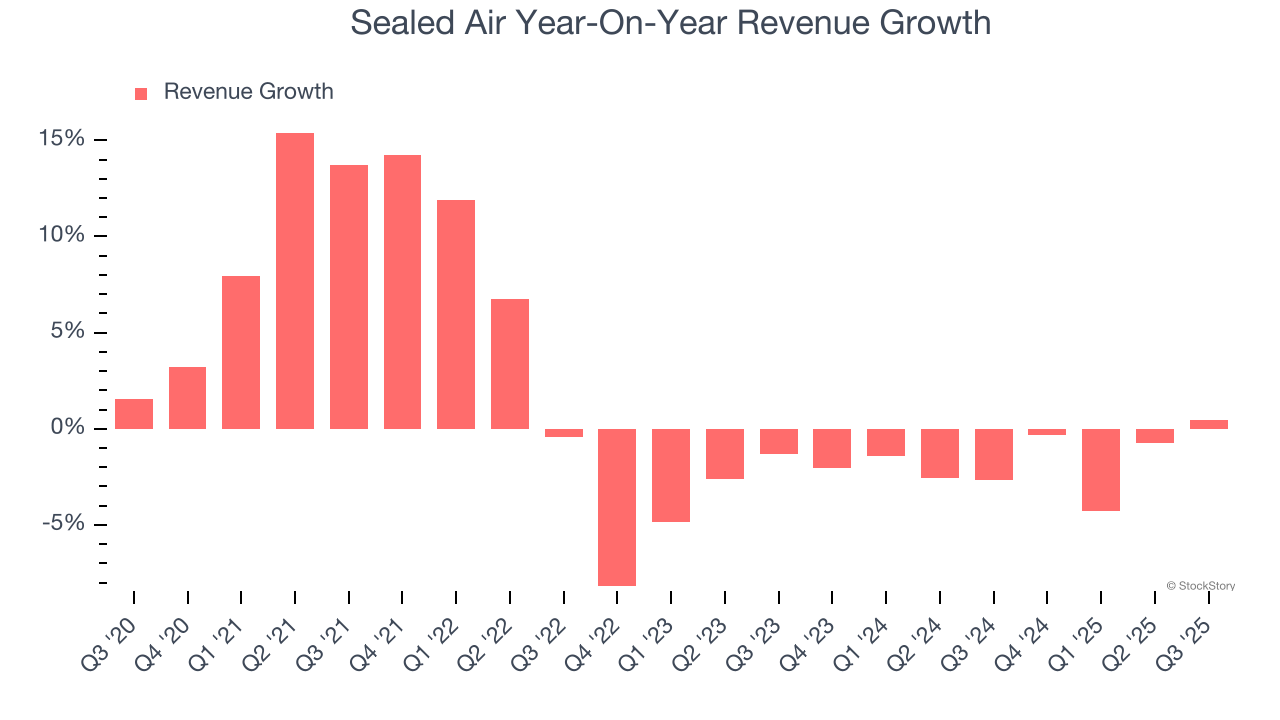
This quarter, Sealed Air’s $1.35 billion of revenue was flat year on year but beat Wall Street’s estimates by 2.7%.
Looking ahead, sell-side analysts expect revenue to remain flat over the next 12 months. Although this projection suggests its newer products and services will fuel better top-line performance, it is still below the sector average.
Microsoft, Alphabet, Coca-Cola, Monster Beverage—all began as under-the-radar growth stories riding a massive trend. We’ve identified the next one: a profitable AI semiconductor play Wall Street is still overlooking. Go here for access to our full report.
Operating Margin
Sealed Air has been an efficient company over the last five years. It was one of the more profitable businesses in the industrials sector, boasting an average operating margin of 15.1%.
Looking at the trend in its profitability, Sealed Air’s operating margin decreased by 1.8 percentage points over the last five years. This raises questions about the company’s expense base because its revenue growth should have given it leverage on its fixed costs, resulting in better economies of scale and profitability.
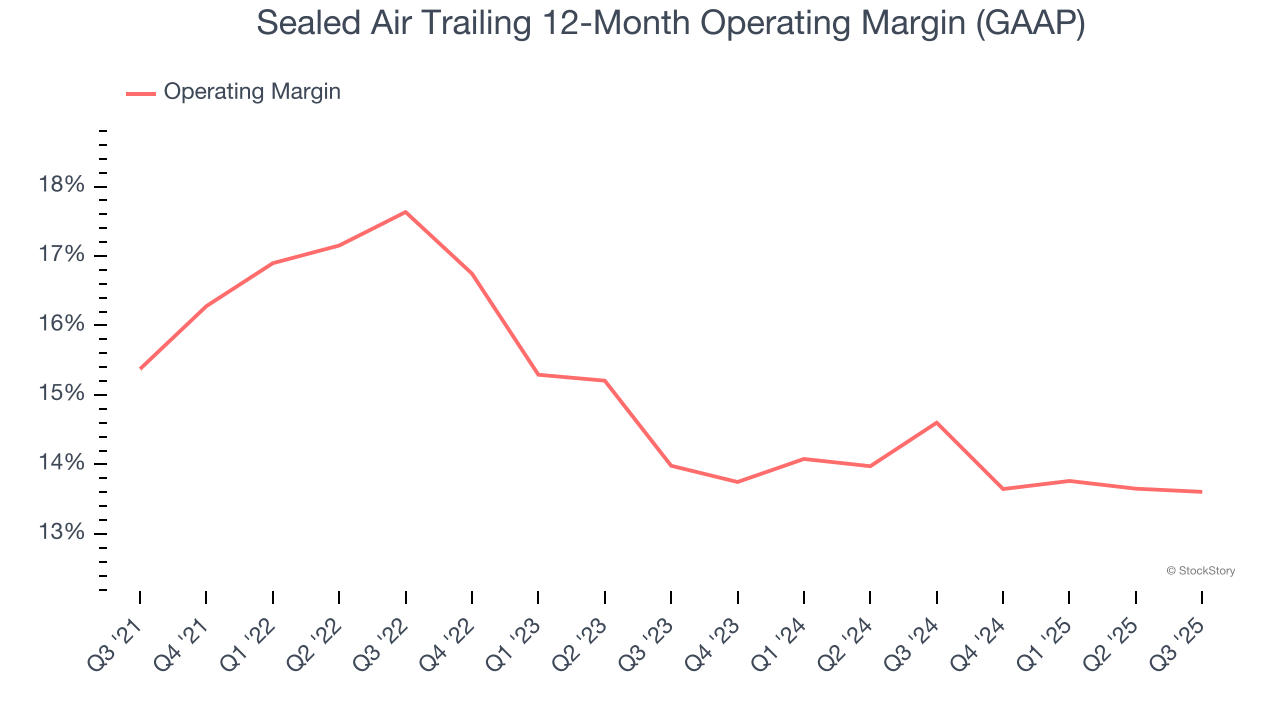
In Q3, Sealed Air generated an operating margin profit margin of 13.7%, in line with the same quarter last year. This indicates the company’s cost structure has recently been stable.
Earnings Per Share
Revenue trends explain a company’s historical growth, but the long-term change in earnings per share (EPS) points to the profitability of that growth – for example, a company could inflate its sales through excessive spending on advertising and promotions.
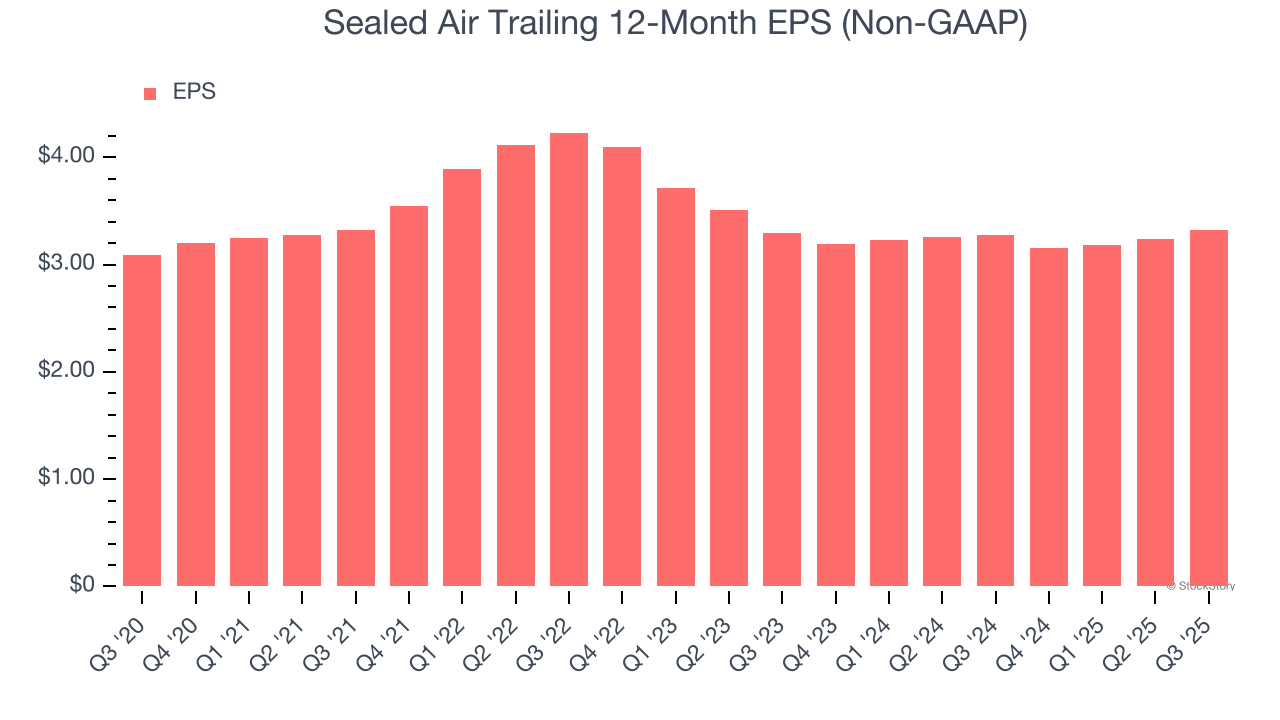
Sealed Air’s weak 1.4% annual EPS growth over the last five years aligns with its revenue performance. This tells us it maintained its per-share profitability as it expanded.
Like with revenue, we analyze EPS over a shorter period to see if we are missing a change in the business.
Although it wasn’t great, Sealed Air’s flat two-year EPS topped its two-year revenue performance.
We can take a deeper look into Sealed Air’s earnings to better understand the drivers of its performance. While we mentioned earlier that Sealed Air’s operating margin was flat this quarter, a two-year view shows its margin has expanded. This was the most relevant factor (aside from the revenue impact) behind its higher earnings; interest expenses and taxes can also affect EPS but don’t tell us as much about a company’s fundamentals.
In Q3, Sealed Air reported adjusted EPS of $0.87, up from $0.79 in the same quarter last year. This print easily cleared analysts’ estimates, and shareholders should be content with the results. Over the next 12 months, Wall Street expects Sealed Air’s full-year EPS of $3.32 to shrink by 4.3%.
Key Takeaways from Sealed Air’s Q3 Results
It was good to see Sealed Air beat analysts’ EPS expectations this quarter. We were also glad its EBITDA outperformed Wall Street’s estimates. Zooming out, we think this quarter featured some important positives. The market seemed to be hoping for more, and the stock traded down 1.1% to $33.62 immediately following the results.
Is Sealed Air an attractive investment opportunity at the current price? We think that the latest quarter is only one piece of the longer-term business quality puzzle. Quality, when combined with valuation, can help determine if the stock is a buy. We cover that in our actionable full research report which you can read here, it’s free for active Edge members.