Skincare company BeautyHealth (NASDAQ: SKIN) reported revenue ahead of Wall Streets expectations in Q3 CY2025, but sales fell by 10.3% year on year to $70.7 million. The company’s full-year revenue guidance of $296.5 million at the midpoint came in 0.8% above analysts’ estimates. Its GAAP loss of $0.09 per share was in line with analysts’ consensus estimates.
Is now the time to buy BeautyHealth? Find out by accessing our full research report, it’s free for active Edge members.
BeautyHealth (SKIN) Q3 CY2025 Highlights:
- Revenue: $70.7 million vs analyst estimates of $68.91 million (10.3% year-on-year decline, 2.6% beat)
- EPS (GAAP): -$0.09 vs analyst estimates of -$0.08 (in line)
- Adjusted EBITDA: $8.9 million vs analyst estimates of $2.58 million (12.6% margin, significant beat)
- The company lifted its revenue guidance for the full year to $296.5 million at the midpoint from $292.5 million, a 1.4% increase
- EBITDA guidance for the full year is $38 million at the midpoint, above analyst estimates of $30.5 million
- Operating Margin: -8.8%, up from -27.3% in the same quarter last year
- Free Cash Flow Margin: 13.7%, up from 10.4% in the same quarter last year
- Market Capitalization: $186.4 million
“Our third-quarter results reflect disciplined execution and the continued strengthening of BeautyHealth’s foundation,” said BeautyHealth President and CEO, Pedro Malha.
Company Overview
Operating in the emerging beauty health category, the appropriately named BeautyHealth (NASDAQ: SKIN) is a skincare company best known for its Hydrafacial product that cleanses and hydrates skin.
Revenue Growth
A company’s long-term sales performance can indicate its overall quality. Any business can experience short-term success, but top-performing ones enjoy sustained growth for years.
With $302 million in revenue over the past 12 months, BeautyHealth is a small consumer staples company, which sometimes brings disadvantages compared to larger competitors benefiting from economies of scale and negotiating leverage with retailers.
As you can see below, BeautyHealth struggled to generate demand over the last three years. Its sales dropped by 4.4% annually, a poor baseline for our analysis.
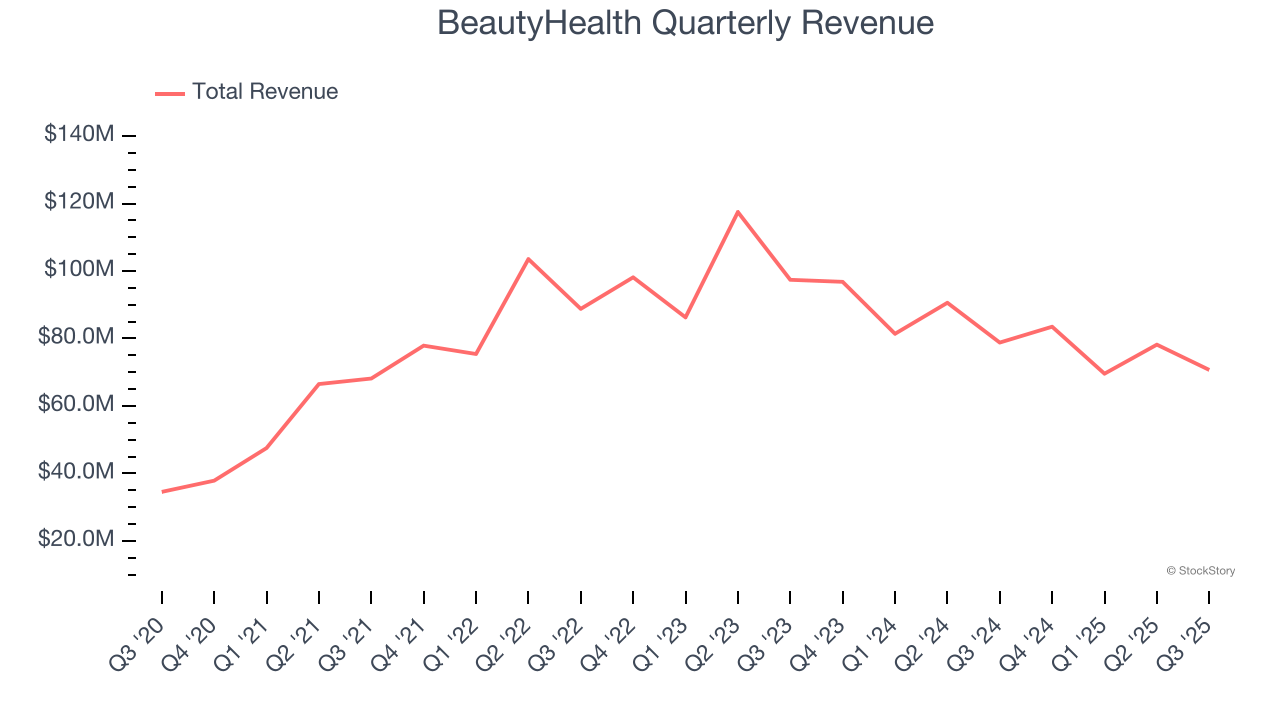
This quarter, BeautyHealth’s revenue fell by 10.3% year on year to $70.7 million but beat Wall Street’s estimates by 2.6%.
Looking ahead, sell-side analysts expect revenue to remain flat over the next 12 months. Although this projection indicates its newer products will fuel better top-line performance, it is still below the sector average.
While Wall Street chases Nvidia at all-time highs, an under-the-radar semiconductor supplier is dominating a critical AI component these giants can’t build without. Click here to access our free report one of our favorites growth stories.
Cash Is King
Although earnings are undoubtedly valuable for assessing company performance, we believe cash is king because you can’t use accounting profits to pay the bills.
BeautyHealth has shown mediocre cash profitability over the last two years, giving the company limited opportunities to return capital to shareholders. Its free cash flow margin averaged 3.3%, subpar for a consumer staples business.
Taking a step back, an encouraging sign is that BeautyHealth’s margin expanded by 15.6 percentage points over the last year. The company’s improvement shows it’s heading in the right direction, and we can see it became a less capital-intensive business because its free cash flow profitability rose more than its operating profitability.
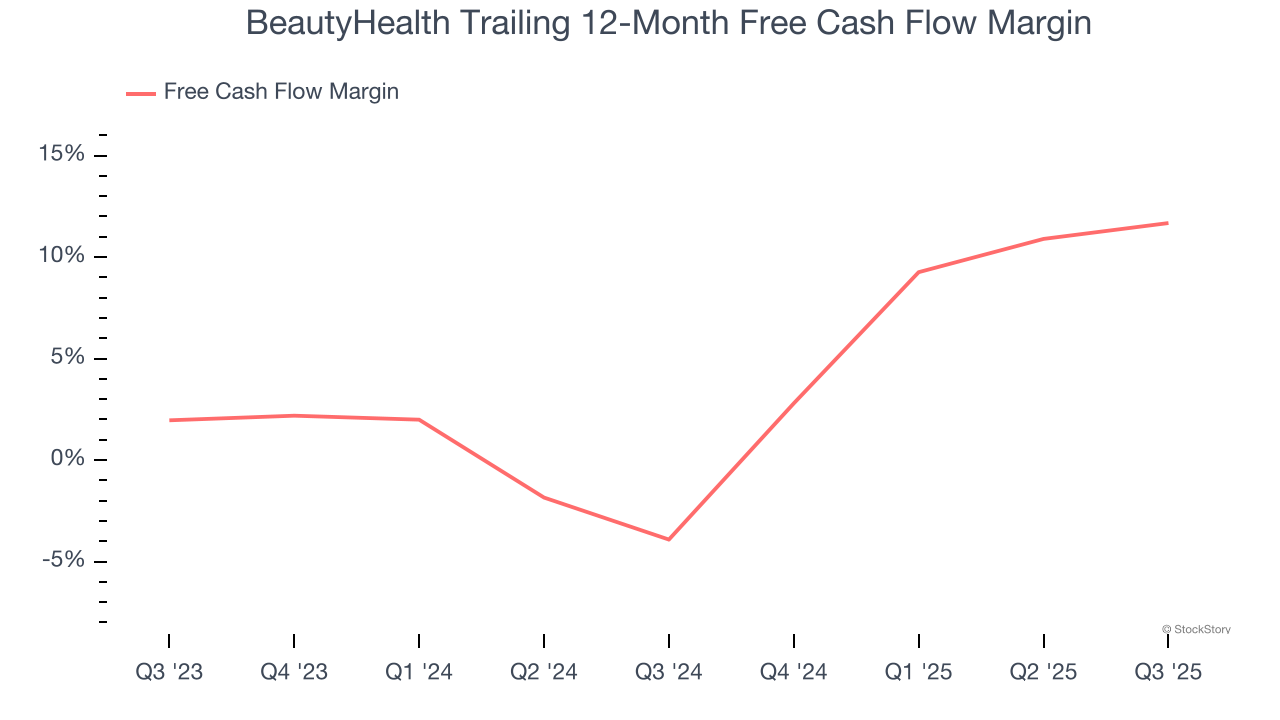
BeautyHealth’s free cash flow clocked in at $9.7 million in Q3, equivalent to a 13.7% margin. This result was good as its margin was 3.3 percentage points higher than in the same quarter last year, building on its favorable historical trend.
Key Takeaways from BeautyHealth’s Q3 Results
We were impressed by how significantly BeautyHealth blew past analysts’ EBITDA expectations this quarter. We were also glad its full-year EBITDA guidance trumped Wall Street’s estimates. On the other hand, its EPS was in line and its gross margin fell short of Wall Street’s estimates. Overall, we think this was still a decent quarter with some key metrics above expectations. The stock traded up 16.7% to $1.50 immediately after reporting.
Sure, BeautyHealth had a solid quarter, but if we look at the bigger picture, is this stock a buy? When making that decision, it’s important to consider its valuation, business qualities, as well as what has happened in the latest quarter. We cover that in our actionable full research report which you can read here, it’s free for active Edge members.