
Private markets investment firm P10 (NYSE: PX) fell short of the markets revenue expectations in Q3 CY2025 as sales rose 2.2% year on year to $75.9 million. Its non-GAAP profit of $0.24 per share was in line with analysts’ consensus estimates.
Is now the time to buy P10? Find out by accessing our full research report, it’s free for active Edge members.
P10 (PX) Q3 CY2025 Highlights:
Company Overview
Operating as a bridge between institutional investors and hard-to-access private market opportunities, P10 (NYSE: PX) is an alternative asset management firm that provides access to private equity, venture capital, impact investing, and private credit opportunities in the middle and lower middle markets.
Revenue Growth
A company’s long-term performance is an indicator of its overall quality. Even a bad business can shine for one or two quarters, but a top-tier one grows for years. Over the last five years, P10 grew its revenue at an incredible 38.3% compounded annual growth rate. Its growth beat the average financials company and shows its offerings resonate with customers, a helpful starting point for our analysis.
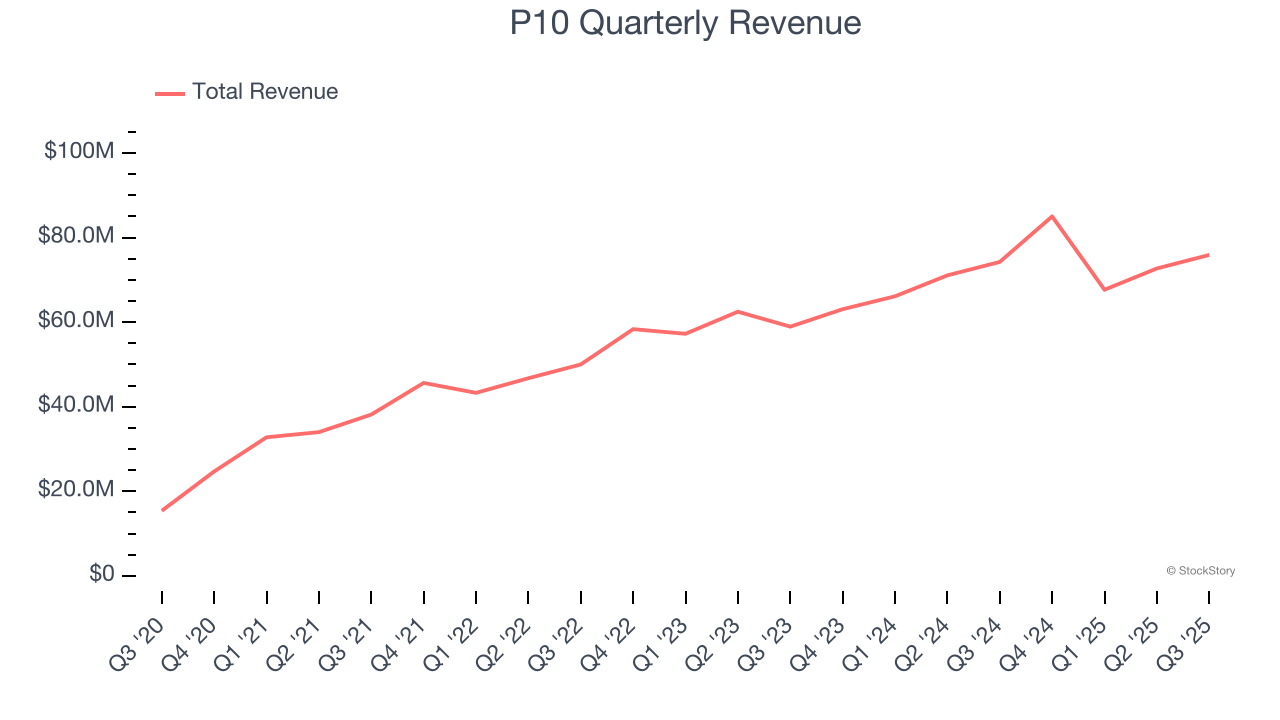
We at StockStory place the most emphasis on long-term growth, but within financials, a half-decade historical view may miss recent interest rate changes, market returns, and industry trends. P10’s annualized revenue growth of 12.7% over the last two years is below its five-year trend, but we still think the results suggest healthy demand. 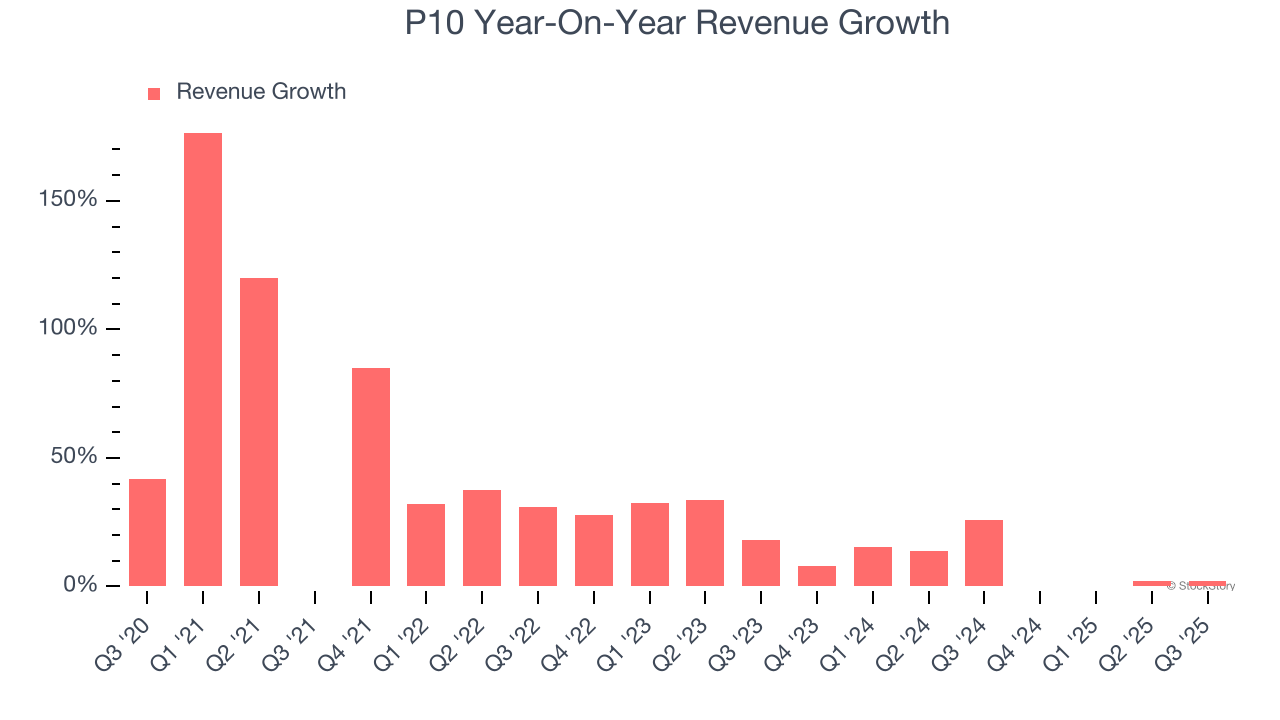 Note: Quarters not shown were determined to be outliers, impacted by outsized investment gains/losses that are not indicative of the recurring fundamentals of the business.
This quarter, P10’s revenue grew by 2.2% year on year to $75.9 million, falling short of Wall Street’s estimates.
Software is eating the world and there is virtually no industry left that has been untouched by it. That drives increasing demand for tools helping software developers do their jobs, whether it be monitoring critical cloud infrastructure, integrating audio and video functionality, or ensuring smooth content streaming. Click here to access a free report on our 3 favorite stocks to play this generational megatrend.
Assets Under Management (AUM)
Assets Under Management (AUM) is the cornerstone of a financial firm's investment division, representing all client capital under its stewardship. Management fees on this AUM create reliable, recurring revenue that maintains stability even when investment performance struggles, though prolonged poor returns can eventually affect asset retention and growth.
P10’s AUM has grown at an annual rate of 18.3% over the last four years, better than the broader financials industry. When analyzing P10’s AUM over the last two years, we can see that growth decelerated to 12% annually. This performance aligned with its total revenue.
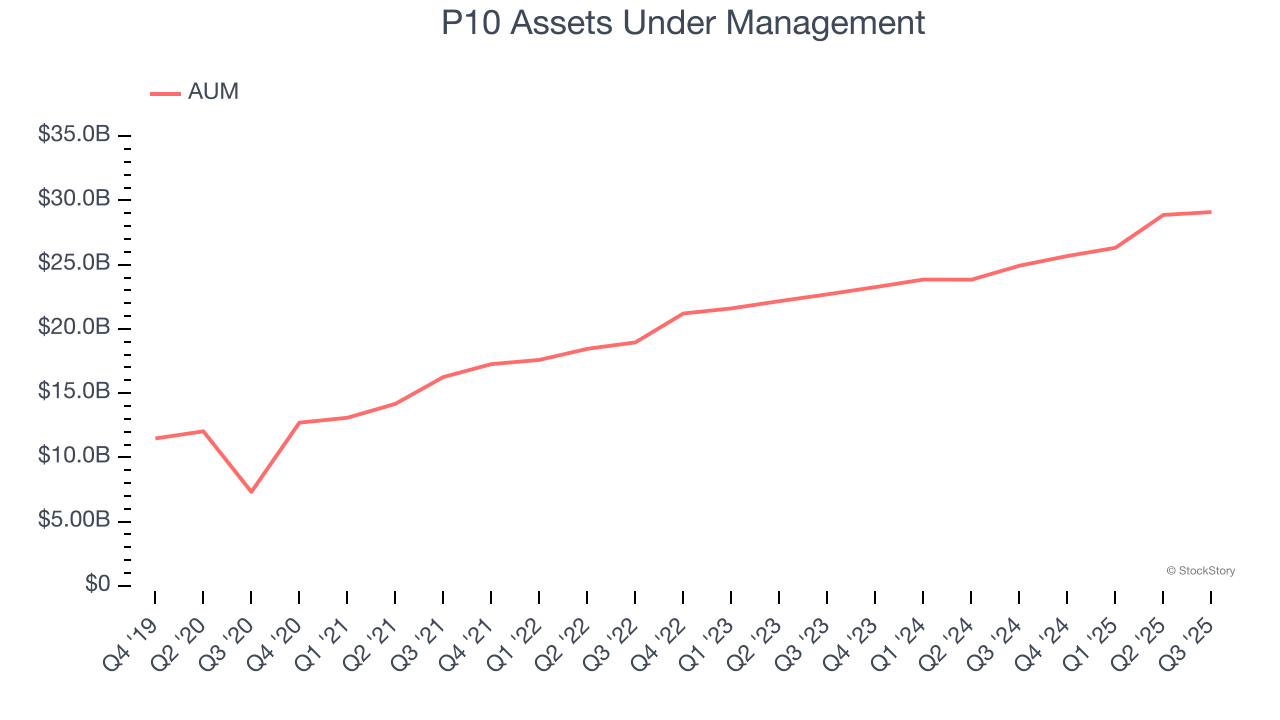
In Q3, P10’s AUM was $29.1 billion, falling 1.9% short of analysts’ expectations. This print was 16.8% higher than the same quarter last year.
Key Takeaways from P10’s Q3 Results
It was encouraging to see P10 meet analysts’ EPS expectations this quarter. On the other hand, its AUM missed and its revenue fell short of Wall Street’s estimates. Overall, this was a softer quarter. The stock traded up 2% to $10.79 immediately after reporting.
Should you buy the stock or not? The latest quarter does matter, but not nearly as much as longer-term fundamentals and valuation, when deciding if the stock is a buy. We cover that in our actionable full research report which you can read here, it’s free for active Edge members.