
Fast-food chain Jack in the Box (NASDAQ: JACK) met Wall Street’s revenue expectations in Q4 CY2024, but sales fell by 3.7% year on year to $469.4 million. Its non-GAAP profit of $1.92 per share was 13.8% above analysts’ consensus estimates.
Is now the time to buy Jack in the Box? Find out by accessing our full research report, it’s free.
Jack in the Box (JACK) Q4 CY2024 Highlights:
- Revenue: $469.4 million vs analyst estimates of $470.6 million (3.7% year-on-year decline, in line)
- Adjusted EPS: $1.92 vs analyst estimates of $1.69 (13.8% beat)
- Adjusted EBITDA: $97.24 million vs analyst estimates of $90.79 million (20.7% margin, 7.1% beat)
- EBITDA guidance for the full year is $295.50 at the midpoint, above analyst estimates of $289.9 million
- Operating Margin: 15.8%, in line with the same quarter last year
- Free Cash Flow was $70.56 million, up from -$61.5 million in the same quarter last year
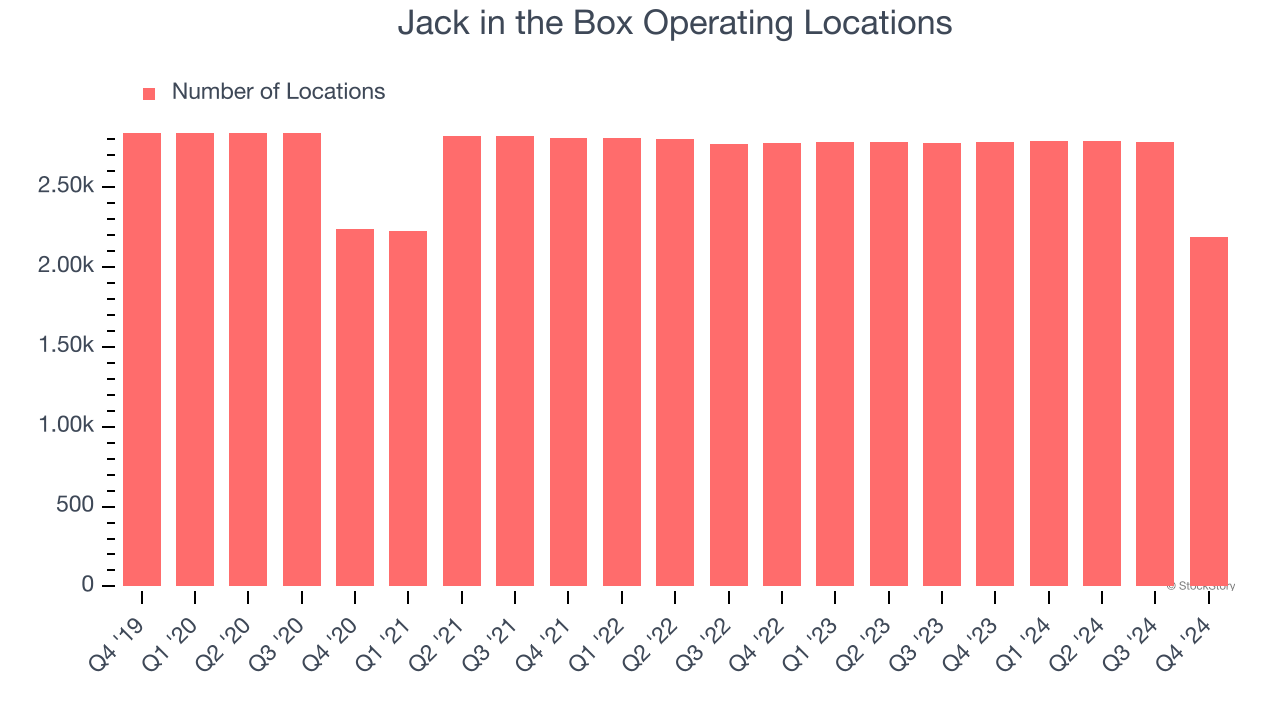
- Locations: 2,190 at quarter end, down from 2,784 in the same quarter last year
- Same-Store Sales were flat year on year, in line with the same quarter last year
- Market Capitalization: $693.5 million
Company Overview
Delighting customers since its inception in 1951, Jack in the Box (NASDAQ: JACK) is a distinctive fast-food chain known for its bold flavors, innovative menu items, and quirky marketing.
Traditional Fast Food
Traditional fast-food restaurants are renowned for their speed and convenience, boasting menus filled with familiar and budget-friendly items. Their reputations for on-the-go consumption make them favored destinations for individuals and families needing a quick meal. This class of restaurants, however, is fighting the perception that their meals are unhealthy and made with inferior ingredients, a battle that's especially relevant today given the consumers increasing focus on health and wellness.
Sales Growth
A company’s long-term performance is an indicator of its overall quality. While any business can experience short-term success, top-performing ones enjoy sustained growth for years.
With $1.55 billion in revenue over the past 12 months, Jack in the Box is a mid-sized restaurant chain, which sometimes brings disadvantages compared to larger competitors benefiting from better brand awareness and economies of scale. On the other hand, it has an edge over smaller competitors with fewer resources and can still flex high growth rates because it’s working from a smaller revenue base.
As you can see below, Jack in the Box’s sales grew at a decent 9.9% compounded annual growth rate over the last five years (we compare to 2019 to normalize for COVID-19 impacts) despite closing restaurants, implying that growth was driven by higher sales at existing, established dining locations.
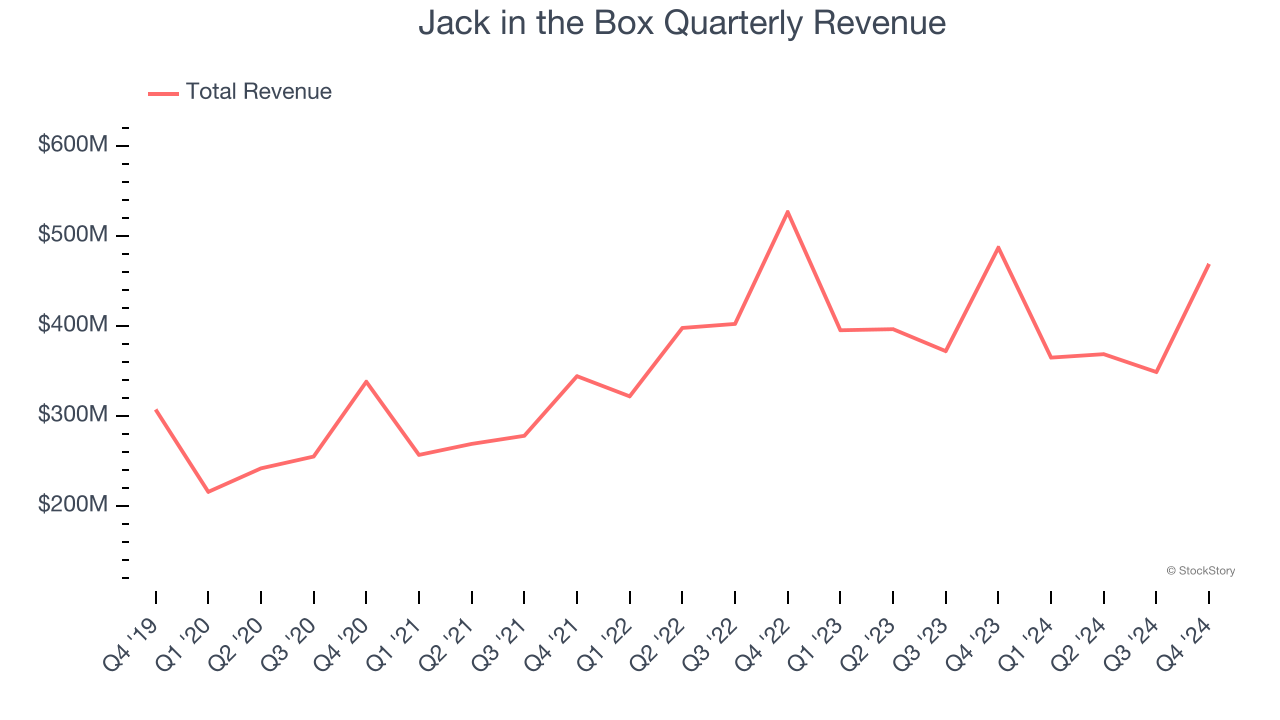
This quarter, Jack in the Box reported a rather uninspiring 3.7% year-on-year revenue decline to $469.4 million of revenue, in line with Wall Street’s estimates.
Looking ahead, sell-side analysts expect revenue to remain flat over the next 12 months, a deceleration versus the last five years. This projection is underwhelming and implies its menu offerings will face some demand challenges.
Unless you’ve been living under a rock, it should be obvious by now that generative AI is going to have a huge impact on how large corporations do business. While Nvidia and AMD are trading close to all-time highs, we prefer a lesser-known (but still profitable) stock benefiting from the rise of AI. Click here to access our free report one of our favorites growth stories.
Restaurant Performance
Number of Restaurants
Jack in the Box operated 2,190 locations in the latest quarter. Over the last two years, the company has generally closed its restaurants, averaging 2.7% annual declines.
When a chain shutters restaurants, it usually means demand for its meals is waning, and it is responding by closing underperforming locations to improve profitability.
Same-Store Sales
The change in a company's restaurant base only tells one side of the story. The other is the performance of its existing locations, which informs management teams whether they should expand or downsize their physical footprints. Same-store sales gives us insight into this topic because it measures organic growth at restaurants open for at least a year.
Jack in the Box’s demand within its existing dining locations has been relatively stable over the last two years but was below most restaurant chains. On average, the company’s same-store sales have grown by 1.5% per year. Given its declining restaurant base over the same period, this performance stems from a mixture of higher prices and increased foot traffic at existing locations (closing restaurants can sometimes boost same-store sales).
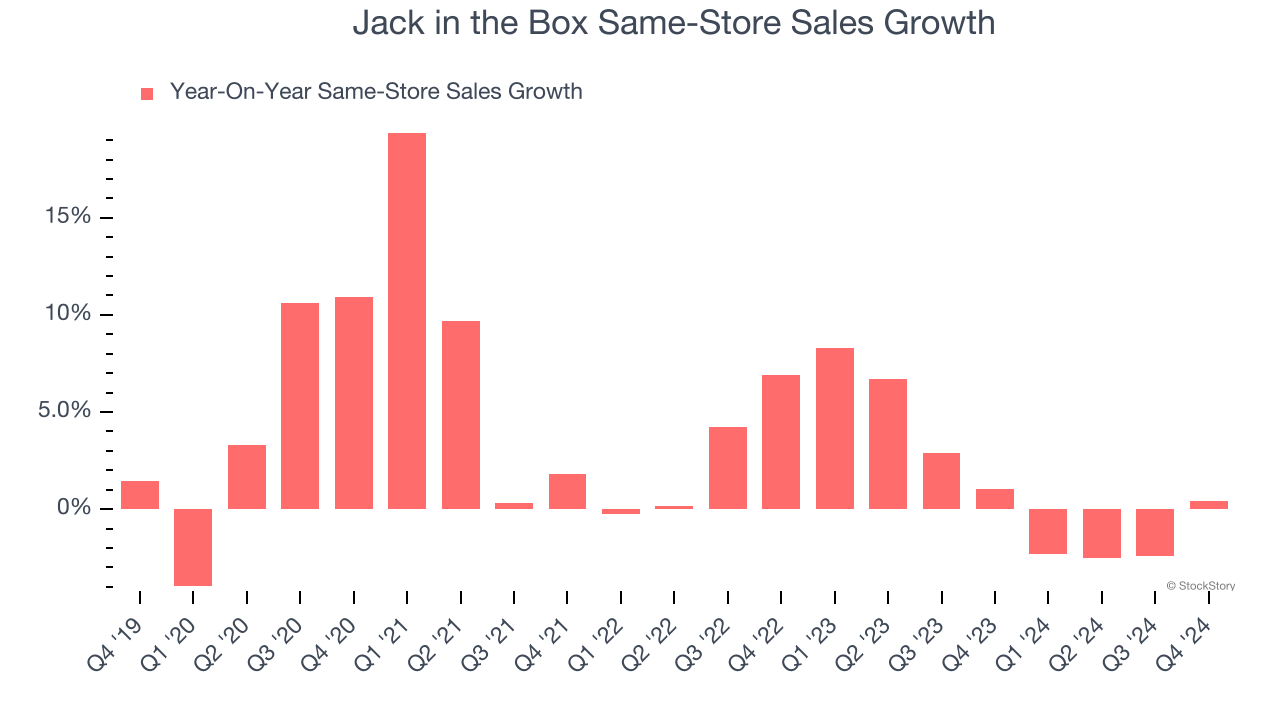
In the latest quarter, Jack in the Box’s year on year same-store sales were flat. This was a meaningful deceleration from its historical levels. We’ll be watching closely to see if Jack in the Box can reaccelerate growth.
Key Takeaways from Jack in the Box’s Q4 Results
We enjoyed seeing Jack in the Box beat analysts’ same-store sales, EPS, and EBITDA expectations this quarter. We were also glad its full-year EBITDA guidance topped estimates. Overall, this quarter had some key positives. The stock traded up 16.1% to $39.42 immediately following the results.
Big picture, is Jack in the Box a buy here and now? When making that decision, it’s important to consider its valuation, business qualities, as well as what has happened in the latest quarter. We cover that in our actionable full research report which you can read here, it’s free.


