
Pharmaceutical company Amphastar Pharmaceuticals (NASDAQAMPH) missed Wall Street’s revenue expectations in Q4 CY2024 as sales rose 4.7% year on year to $186.5 million. Its non-GAAP profit of $0.92 per share was 1.9% below analysts’ consensus estimates.
Is now the time to buy Amphastar Pharmaceuticals? Find out by accessing our full research report, it’s free.
Amphastar Pharmaceuticals (AMPH) Q4 CY2024 Highlights:
- Revenue: $186.5 million vs analyst estimates of $189.2 million (4.7% year-on-year growth, 1.4% miss)
- Adjusted EPS: $0.92 vs analyst expectations of $0.94 (1.9% miss)
- Operating Margin: 24.2%, down from 30.3% in the same quarter last year
- Market Capitalization: $1.50 billion
Company Overview
Founded in 1996, Amphastar Pharmaceuticals (NASDAQ: AMPH) develops, manufactures, and markets injectable and inhalation products, focusing on critical care, emergency, and chronic conditions.
Generic Pharmaceuticals
The generic pharmaceutical industry operates on a volume-driven, low-cost business model, producing bioequivalent versions of branded drugs once their patents expire. These companies benefit from consistent demand for affordable medications, as they are critical to reducing healthcare costs. Generics typically face lower R&D expenses and shorter regulatory approval timelines compared to branded drug makers, enabling cost efficiencies. However, the industry is highly competitive, with intense pricing pressures, thin margins, and frequent legal challenges from branded pharmaceutical companies over patent disputes. Looking ahead, the industry is supported by tailwinds such as the role of AI in streamlining drug development (reverse engineering complex formulations) and manufacturing efficiency (optimize processes and remove inefficiencies). Governments and insurers' focus on reducing drug costs can also boost generics' adoption. However, headwinds include escalating pricing pressure from large buyers like pharmacy chains and healthcare distributors as well as evolving regulatory hurdles.
Sales Growth
A company’s long-term sales performance can indicate its overall quality. Any business can put up a good quarter or two, but many enduring ones grow for years. Luckily, Amphastar Pharmaceuticals’s sales grew at an impressive 17.8% compounded annual growth rate over the last five years. Its growth beat the average healthcare company and shows its offerings resonate with customers, a helpful starting point for our analysis.
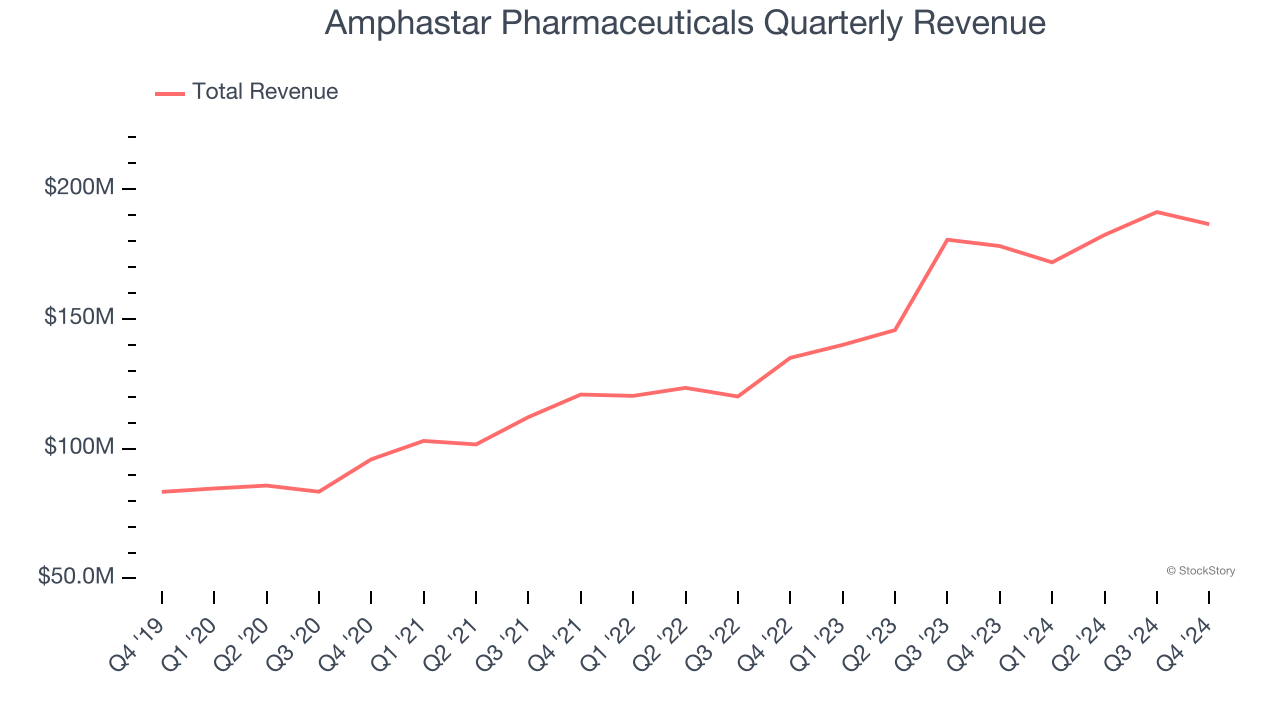
Long-term growth is the most important, but within healthcare, a half-decade historical view may miss new innovations or demand cycles. Amphastar Pharmaceuticals’s annualized revenue growth of 21.1% over the last two years is above its five-year trend, suggesting its demand was strong and recently accelerated. 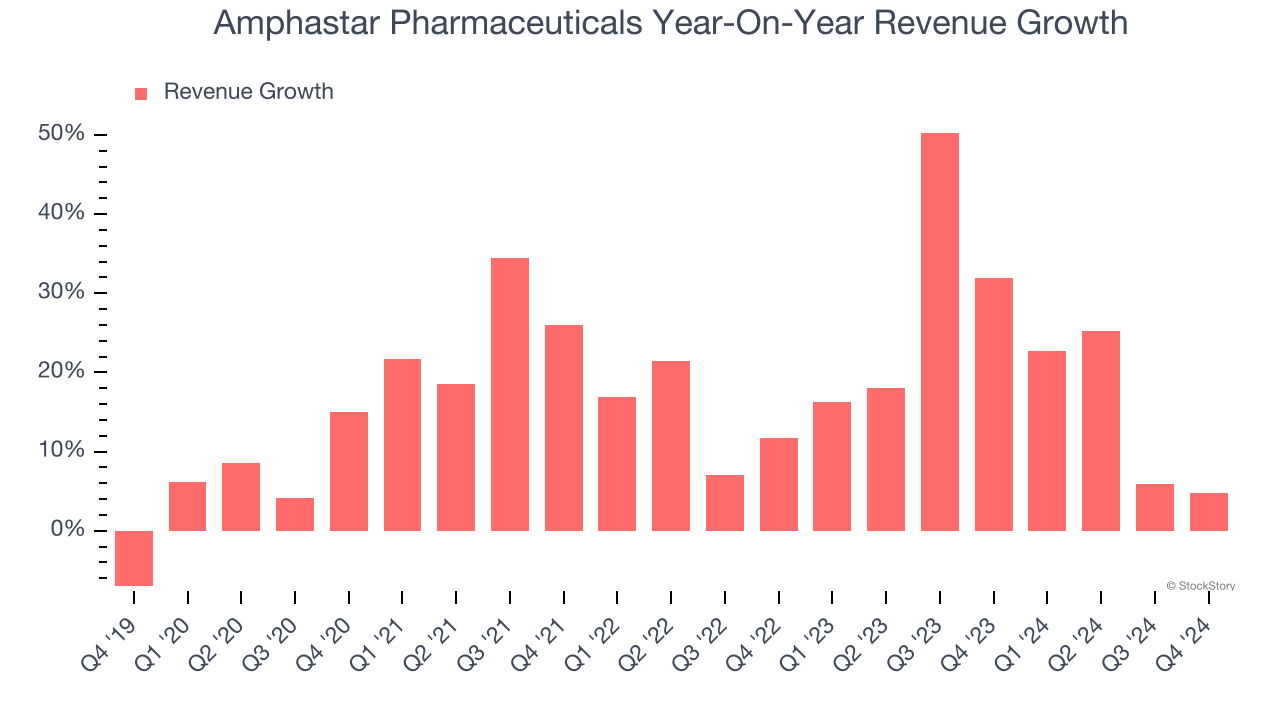
This quarter, Amphastar Pharmaceuticals’s revenue grew by 4.7% year on year to $186.5 million, falling short of Wall Street’s estimates.
Looking ahead, sell-side analysts expect revenue to grow 4.3% over the next 12 months, a deceleration versus the last two years. This projection doesn't excite us and indicates its products and services will see some demand headwinds. At least the company is tracking well in other measures of financial health.
Here at StockStory, we certainly understand the potential of thematic investing. Diverse winners from Microsoft (MSFT) to Alphabet (GOOG), Coca-Cola (KO) to Monster Beverage (MNST) could all have been identified as promising growth stories with a megatrend driving the growth. So, in that spirit, we’ve identified a relatively under-the-radar profitable growth stock benefiting from the rise of AI, available to you FREE via this link.
Operating Margin
Amphastar Pharmaceuticals has been an efficient company over the last five years. It was one of the more profitable businesses in the healthcare sector, boasting an average operating margin of 22.2%.
Looking at the trend in its profitability, Amphastar Pharmaceuticals’s operating margin rose by 24.9 percentage points over the last five years, as its sales growth gave it immense operating leverage. Zooming in on its more recent performance, we can see the company’s trajectory is intact as its margin has also increased by 6.5 percentage points on a two-year basis. These data points are very encouraging and shows momentum is on its side.
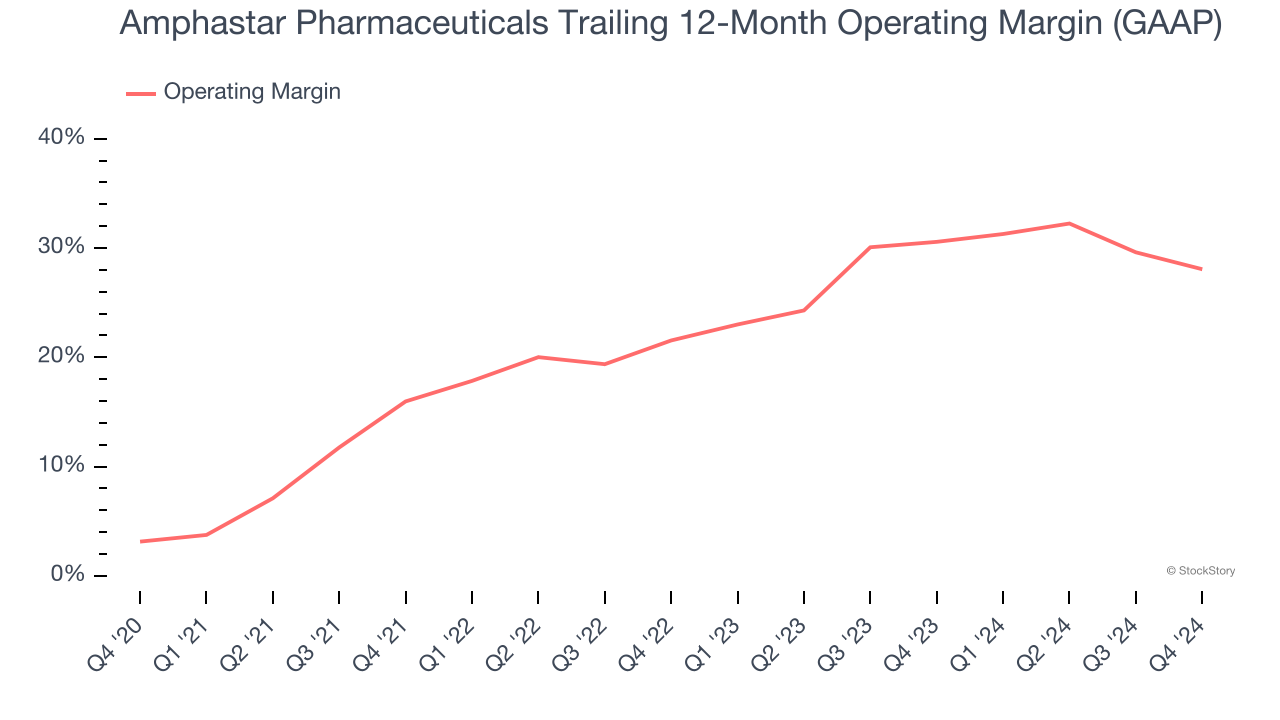
This quarter, Amphastar Pharmaceuticals generated an operating profit margin of 24.2%, down 6.1 percentage points year on year. This contraction shows it was recently less efficient because its expenses grew faster than its revenue.
Earnings Per Share
We track the long-term change in earnings per share (EPS) for the same reason as long-term revenue growth. Compared to revenue, however, EPS highlights whether a company’s growth is profitable.
Amphastar Pharmaceuticals’s EPS grew at an astounding 61.6% compounded annual growth rate over the last five years, higher than its 17.8% annualized revenue growth. This tells us the company became more profitable on a per-share basis as it expanded.
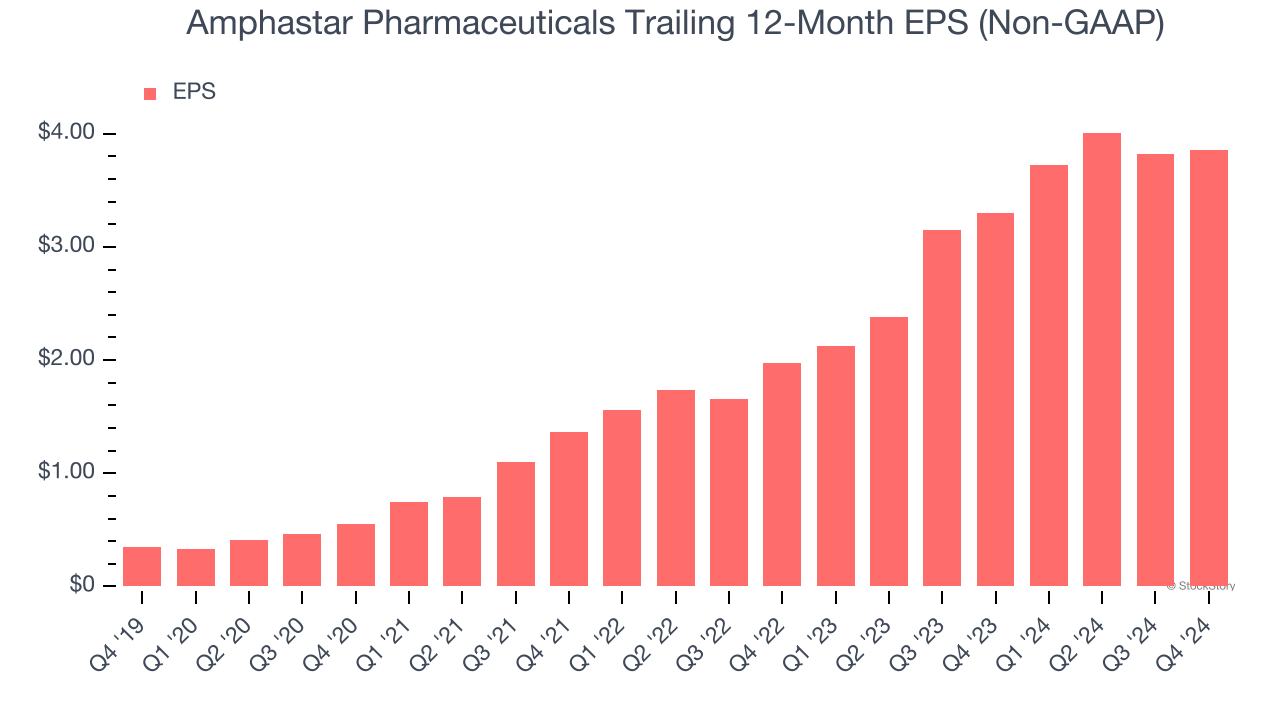
Diving into the nuances of Amphastar Pharmaceuticals’s earnings can give us a better understanding of its performance. As we mentioned earlier, Amphastar Pharmaceuticals’s operating margin declined this quarter but expanded by 24.9 percentage points over the last five years. This was the most relevant factor (aside from the revenue impact) behind its higher earnings; taxes and interest expenses can also affect EPS but don’t tell us as much about a company’s fundamentals.
In Q4, Amphastar Pharmaceuticals reported EPS at $0.92, up from $0.88 in the same quarter last year. Despite growing year on year, this print slightly missed analysts’ estimates, but we care more about long-term EPS growth than short-term movements. Over the next 12 months, Wall Street expects Amphastar Pharmaceuticals’s full-year EPS of $3.86 to shrink by 3%.
Key Takeaways from Amphastar Pharmaceuticals’s Q4 Results
We struggled to find many positives in these results. Its revenue slightly missed and its EPS fell short of Wall Street’s estimates. Overall, this quarter could have been better. The stock traded down 12.1% to $27.64 immediately after reporting.
Amphastar Pharmaceuticals didn’t show it’s best hand this quarter, but does that create an opportunity to buy the stock right now? When making that decision, it’s important to consider its valuation, business qualities, as well as what has happened in the latest quarter. We cover that in our actionable full research report which you can read here, it’s free.


