
Healthcare tech company Premier (NASDAQ: PINC) missed Wall Street’s revenue expectations in Q4 CY2024, with sales falling 28.2% year on year to $240.3 million. The company’s full-year revenue guidance of $975 million at the midpoint came in 1.6% below analysts’ estimates. Its non-GAAP profit of $0.25 per share was 16% below analysts’ consensus estimates.
Is now the time to buy Premier? Find out by accessing our full research report, it’s free.
Premier (PINC) Q4 CY2024 Highlights:
- Revenue: $240.3 million vs analyst estimates of $244.3 million (28.2% year-on-year decline, 1.6% miss)
- Adjusted EPS: $0.25 vs analyst expectations of $0.30 (16% miss)
- Adjusted EBITDA: $50.09 million vs analyst estimates of $58.51 million (20.8% margin, 14.4% miss)
- The company reconfirmed its revenue guidance for the full year of $975 million at the midpoint
- Management raised its full-year Adjusted EPS guidance to $1.30 at the midpoint, a 6.6% increase
- EBITDA guidance for the full year is $245 million at the midpoint, below analyst estimates of $248.5 million
- Operating Margin: -38.6%, down from 19.6% in the same quarter last year
- Free Cash Flow was $89.51 million, up from -$74.29 million in the same quarter last year
- Market Capitalization: $2.15 billion
"Our overall revenue and profitability for the first half of fiscal 2025 were in line with our expectations resulting from better than expected results in our Supply Chain Services segment," said Michael J. Alkire, Premier's President and CEO.
Company Overview
Founded in 1968, Premier (NASDAQ: PINC) offers tech-forward products for healthcare organizations focused on cost management, quality improvement, and supply chain optimization.
Healthcare Technology for Providers
The healthcare technology industry focuses on delivering software, data analytics, and workflow solutions to hospitals, clinics, and other care facilities. These companies enable providers to streamline operations, optimize patient outcomes, and transition to value-based care models. They boast subscription-based revenues or long-term contracts, providing financial stability and growth potential. However, they face challenges such as lengthy sales cycles, significant upfront investment in technology development, and reliance on providers’ adoption of new tools, which can be hindered by budget constraints or resistance to change. Over the next few years, the sector is poised for growth as providers increasingly prioritize digital transformation and efficiency in response to rising healthcare costs and patient demand for seamless care. Tailwinds include the growing adoption of AI-driven tools for patient engagement and operational improvements, government incentives for digitization, and the expansion of telehealth and remote patient monitoring. However, headwinds such as tightening hospital budgets, cybersecurity threats, and the fragmented nature of healthcare systems could slow adoption.
Sales Growth
A company’s long-term sales performance can indicate its overall quality. Any business can put up a good quarter or two, but many enduring ones grow for years. Unfortunately, Premier struggled to consistently increase demand as its $1.18 billion of sales for the trailing 12 months was close to its revenue five years ago. This was below our standards and signals it’s a low quality business.
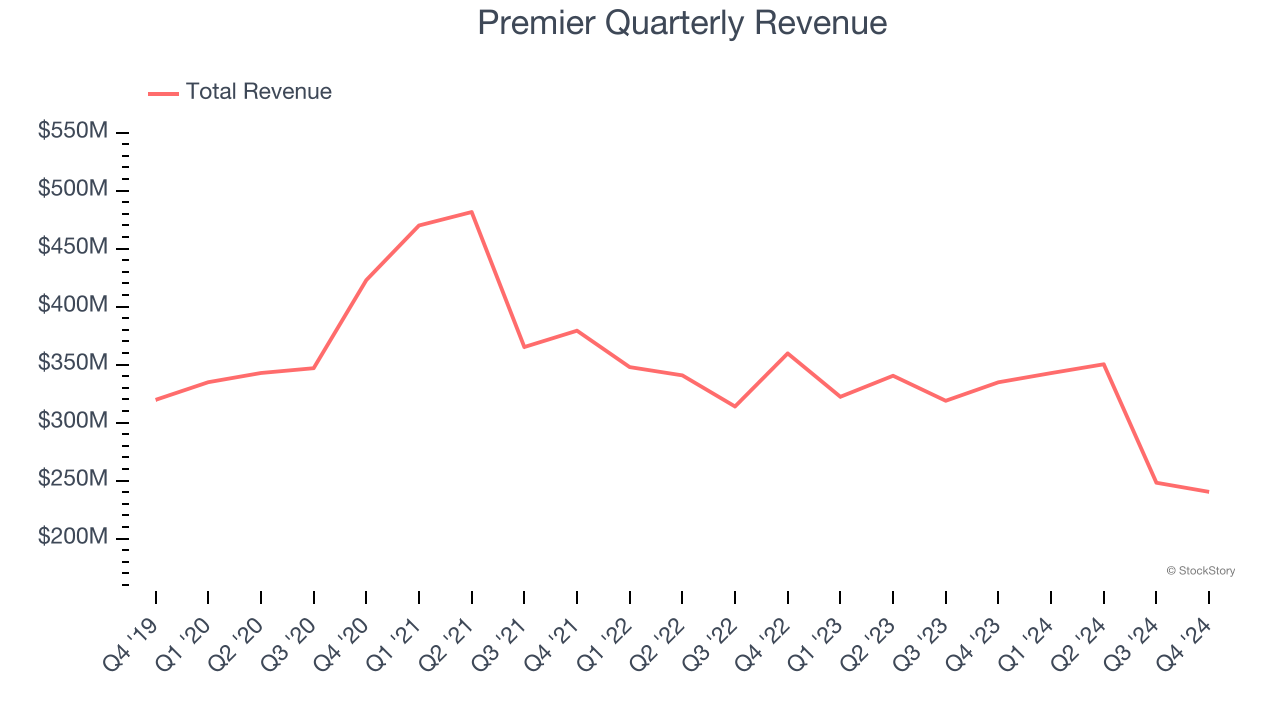
We at StockStory place the most emphasis on long-term growth, but within healthcare, a half-decade historical view may miss recent innovations or disruptive industry trends. Premier’s recent history shows its demand has stayed suppressed as its revenue has declined by 6.9% annually over the last two years.
Premier also breaks out the revenue for its most important segments, Supply Chain and Performance Service, which are 61.9% and 38.1% of revenue. Over the last two years, Premier’s Supply Chain revenue averaged 10.1% year-on-year declines while its Performance Service revenue was flat.
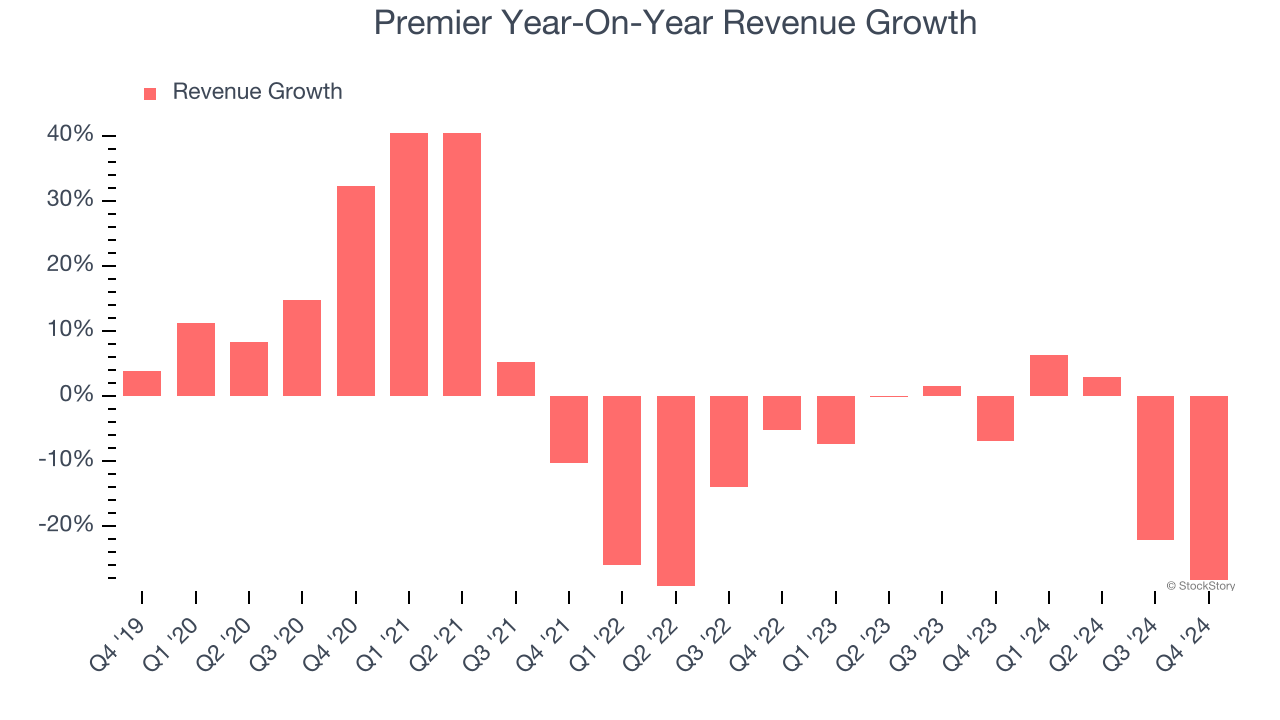
This quarter, Premier missed Wall Street’s estimates and reported a rather uninspiring 28.2% year-on-year revenue decline, generating $240.3 million of revenue.
Looking ahead, sell-side analysts expect revenue to decline by 15% over the next 12 months, a deceleration versus the last two years. This projection is underwhelming and indicates its products and services will face some demand challenges.
Unless you’ve been living under a rock, it should be obvious by now that generative AI is going to have a huge impact on how large corporations do business. While Nvidia and AMD are trading close to all-time highs, we prefer a lesser-known (but still profitable) stock benefiting from the rise of AI. Click here to access our free report one of our favorites growth stories.
Adjusted Operating Margin
Adjusted operating margin is an important measure of profitability as it shows the portion of revenue left after accounting for all core expenses – everything from the cost of goods sold to advertising and wages. It’s also useful for comparing profitability across companies because it excludes non-recurring expenses, interest on debt, and taxes.
Premier has been an efficient company over the last five years. It was one of the more profitable businesses in the healthcare sector, boasting an average adjusted operating margin of 26%.
Analyzing the trend in its profitability, Premier’s adjusted operating margin decreased by 5.4 percentage points over the last five years. The company’s two-year trajectory also shows it failed to get its profitability back to the peak as its margin fell by 1.3 percentage points. This performance was poor no matter how you look at it - it shows operating expenses were rising and it couldn’t pass those costs onto its customers.
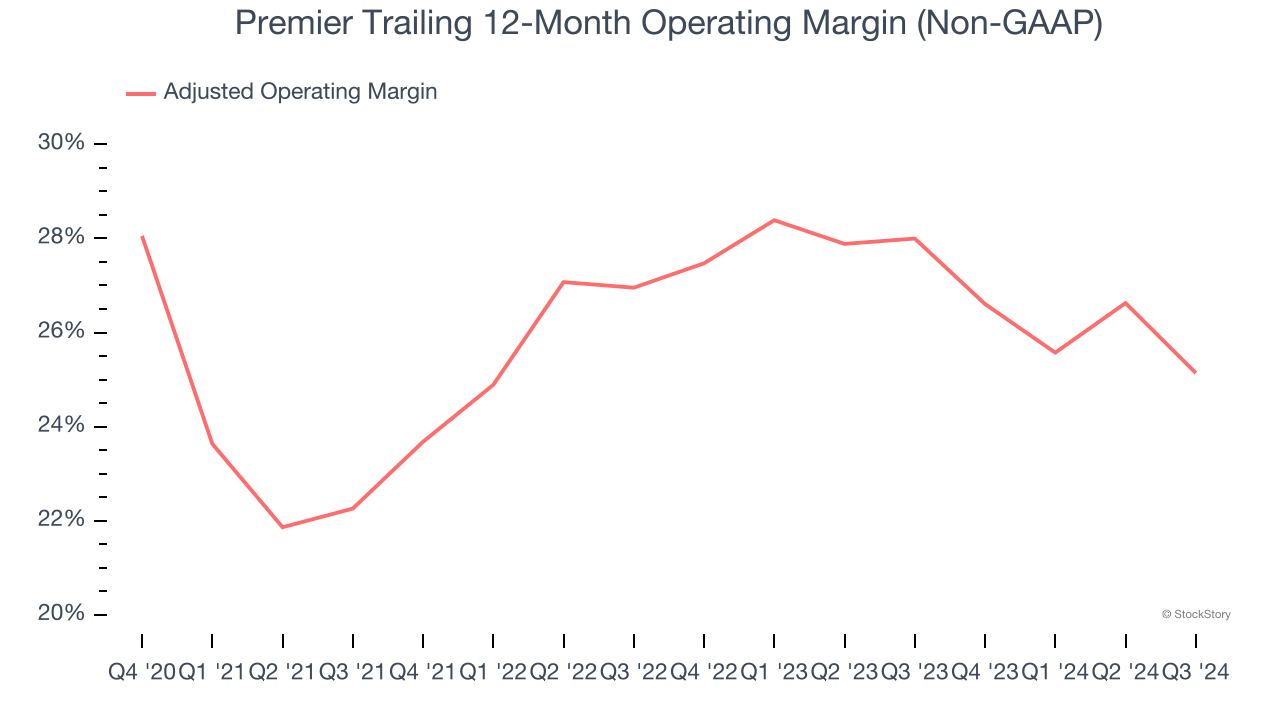
This quarter, Premier generated an adjusted operating profit margin of 20.8%, down 6.5 percentage points year on year. This contraction shows it was recently less efficient because its expenses increased relative to its revenue.
Earnings Per Share
We track the long-term change in earnings per share (EPS) for the same reason as long-term revenue growth. Compared to revenue, however, EPS highlights whether a company’s growth is profitable.
Premier’s EPS grew at an astounding 41.6% compounded annual growth rate over the last five years, higher than its flat revenue. However, we take this with a grain of salt because its adjusted operating margin didn’t expand and it didn’t repurchase its shares, meaning the delta came from reduced interest expenses or taxes.
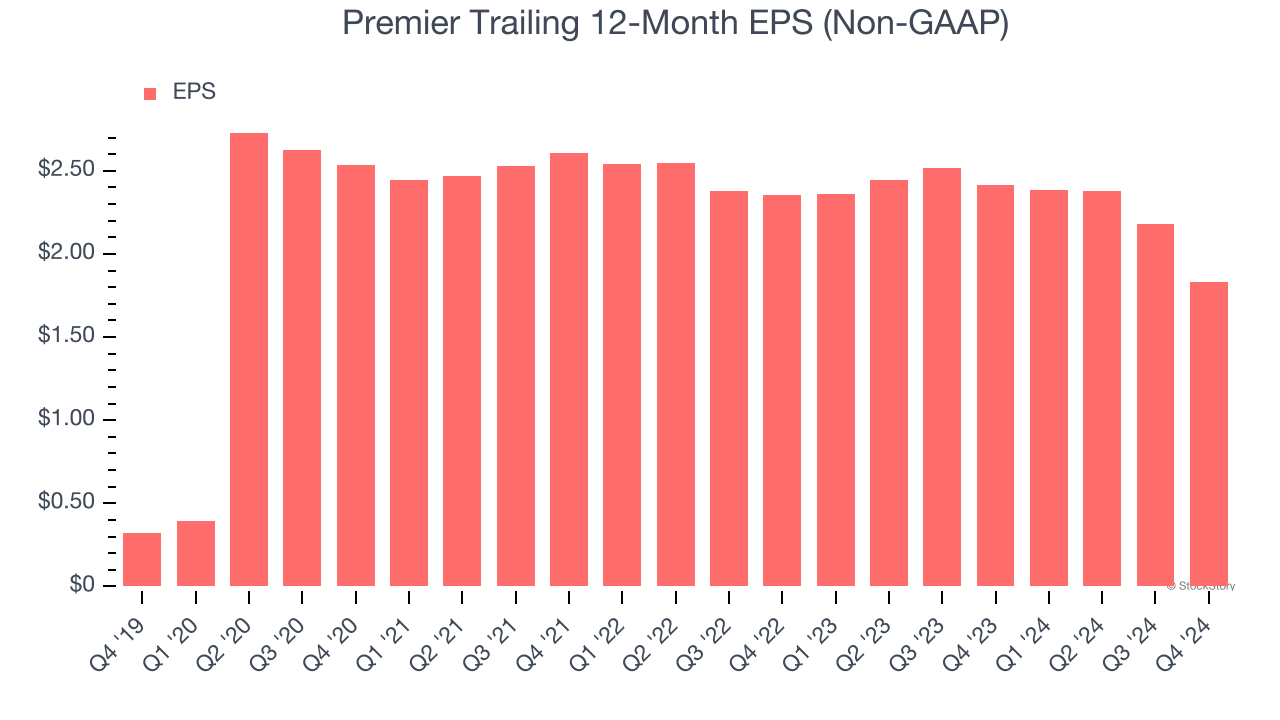
In Q4, Premier reported EPS at $0.25, down from $0.60 in the same quarter last year. This print missed analysts’ estimates, but we care more about long-term EPS growth than short-term movements. Over the next 12 months, Wall Street expects Premier’s full-year EPS of $1.83 to shrink by 31.3%.
Key Takeaways from Premier’s Q4 Results
We struggled to find many positives in these results as its revenue and EPS fell short of Wall Street’s estimates. And although it raised its full-year EPS forecast, its EBITDA guidance (more important) missed. Overall, this was a weaker quarter. The stock remained flat at $22.60 immediately following the results.
Is Premier an attractive investment opportunity at the current price? When making that decision, it’s important to consider its valuation, business qualities, as well as what has happened in the latest quarter. We cover that in our actionable full research report which you can read here, it’s free.


