CAVA’s stock price has taken a beating over the past six months, shedding 33.1% of its value and falling to $81.90 per share. This may have investors wondering how to approach the situation.
Following the pullback, is now the time to buy CAVA? Find out in our full research report, it’s free.
Why Does CAVA Spark Debate?
Starting from a single Washington, D.C. location, CAVA (NYSE: CAVA) operates a fast-casual restaurant chain offering customizable Mediterranean-inspired dishes.
Two Positive Attributes:
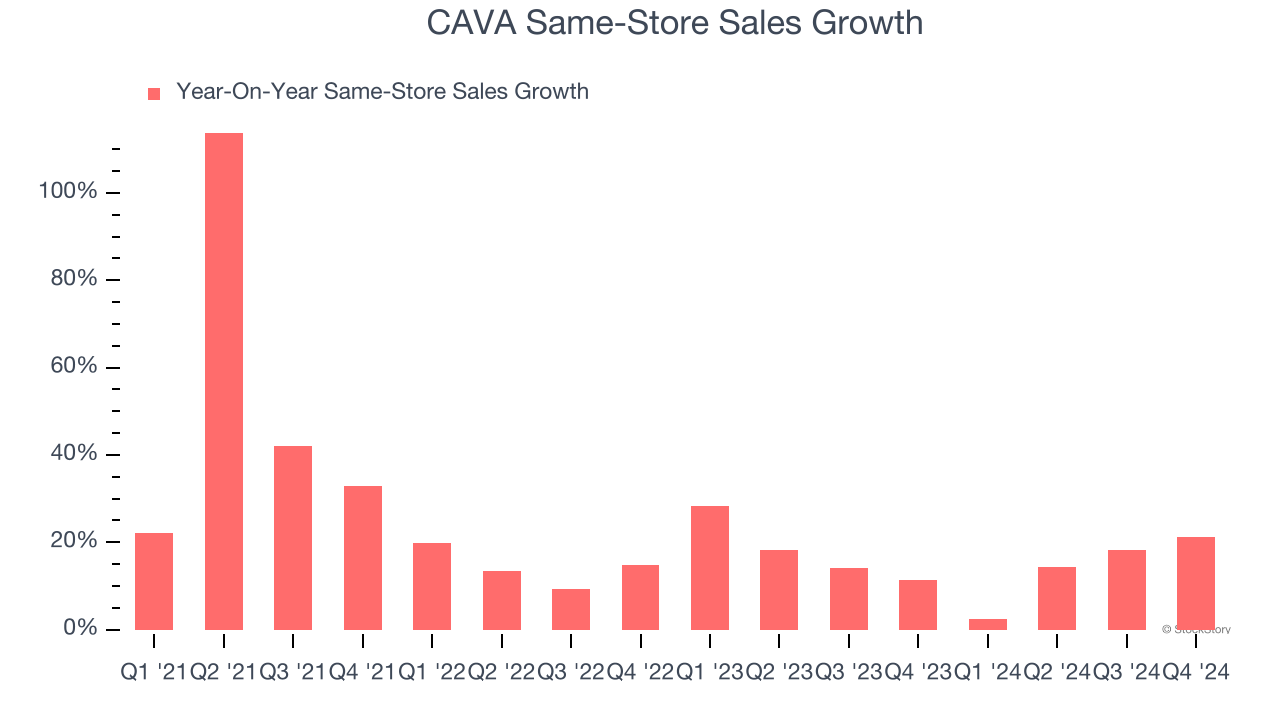
1. Surging Same-Store Sales Show Increasing Demand
Same-store sales is an industry measure of whether revenue is growing at existing restaurants, and it is driven by customer visits (often called traffic) and the average spending per customer (ticket).
CAVA has been one of the most successful restaurant chains over the last two years thanks to skyrocketing demand within its existing dining locations. On average, the company has posted exceptional year-on-year same-store sales growth of 16%.
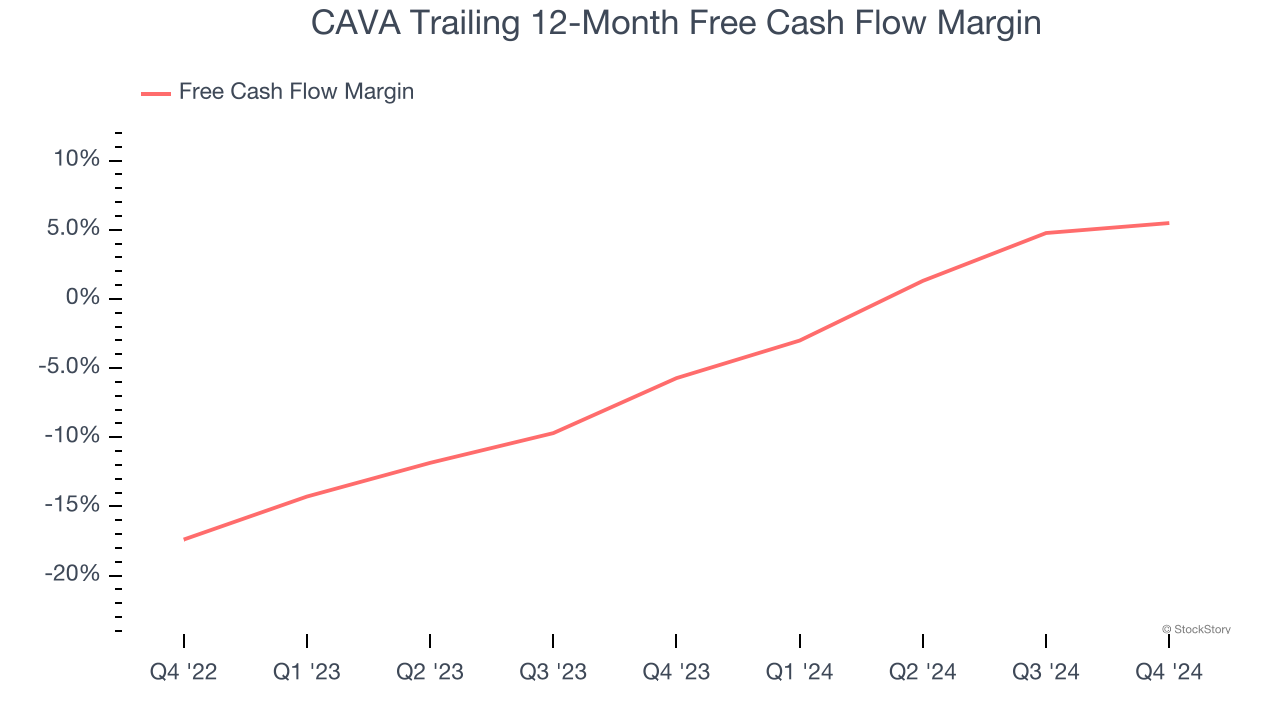
2. Increasing Free Cash Flow Margin Juices Financials
If you’ve followed StockStory for a while, you know we emphasize free cash flow. Why, you ask? We believe that in the end, cash is king, and you can’t use accounting profits to pay the bills.
As you can see below, CAVA’s margin expanded by 11.2 percentage points over the last year. The company’s improvement shows it’s heading in the right direction, and we can see it became a less capital-intensive business because its free cash flow profitability rose more than its operating profitability. CAVA’s free cash flow margin for the trailing 12 months was 5.5%.
One Reason to be Careful:
Previous Growth Initiatives Have Lost Money
Growth gives us insight into a company’s long-term potential, but how capital-efficient was that growth? A company’s ROIC explains this by showing how much operating profit it makes compared to the money it has raised (debt and equity).
Although CAVA has shown solid business quality lately, it struggled to grow profitably in the past. Its five-year average ROIC was negative 17.3%, meaning management lost money while trying to expand the business.
Final Judgment
CAVA’s merits more than compensate for its flaws. With the recent decline, the stock trades at 138.7× forward price-to-earnings (or $81.90 per share). Is now a good time to initiate a position? See for yourself in our comprehensive research report, it’s free.
Stocks We Like Even More Than CAVA
The Trump trade may have passed, but rates are still dropping and inflation is still cooling. Opportunities are ripe for those ready to act - and we’re here to help you pick them.
Get started by checking out our Top 9 Market-Beating Stocks. This is a curated list of our High Quality stocks that have generated a market-beating return of 175% over the last five years.
Stocks that made our list in 2019 include now familiar names such as Nvidia (+2,183% between December 2019 and December 2024) as well as under-the-radar businesses like Comfort Systems (+751% five-year return). Find your next big winner with StockStory today for free.


