
Rockwell Automation trades at $274.49 and has moved in lockstep with the market. Its shares have returned 5.9% over the last six months while the S&P 500 has gained 5.2%.
Is there a buying opportunity in Rockwell Automation, or does it present a risk to your portfolio? Get the full breakdown from our expert analysts, it’s free.
We're sitting this one out for now. Here are three reasons why there are better opportunities than ROK and a stock we'd rather own.
Why Do We Think Rockwell Automation Will Underperform?
One of the first companies to address industrial automation, Rockwell Automation (NYSE: ROK) sells products that help customers extract more efficiency from their machinery.
1. Slow Organic Growth Suggests Waning Demand In Core Business
Investors interested in Internet of Things companies should track organic revenue in addition to reported revenue. This metric gives visibility into Rockwell Automation’s core business because it excludes one-time events such as mergers, acquisitions, and divestitures along with foreign currency fluctuations - non-fundamental factors that can manipulate the income statement.
Over the last two years, Rockwell Automation’s organic revenue averaged 1.7% year-on-year growth. This performance was underwhelming and suggests it may need to improve its products, pricing, or go-to-market strategy, which can add an extra layer of complexity to its operations. 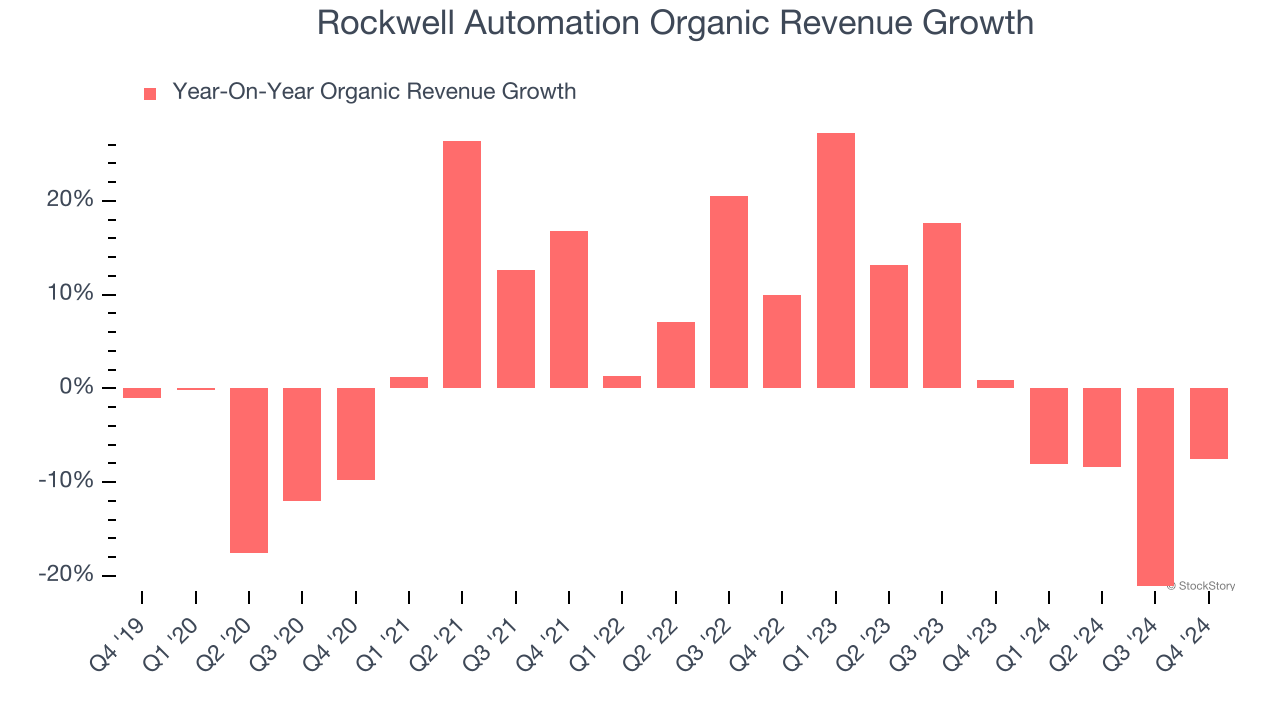
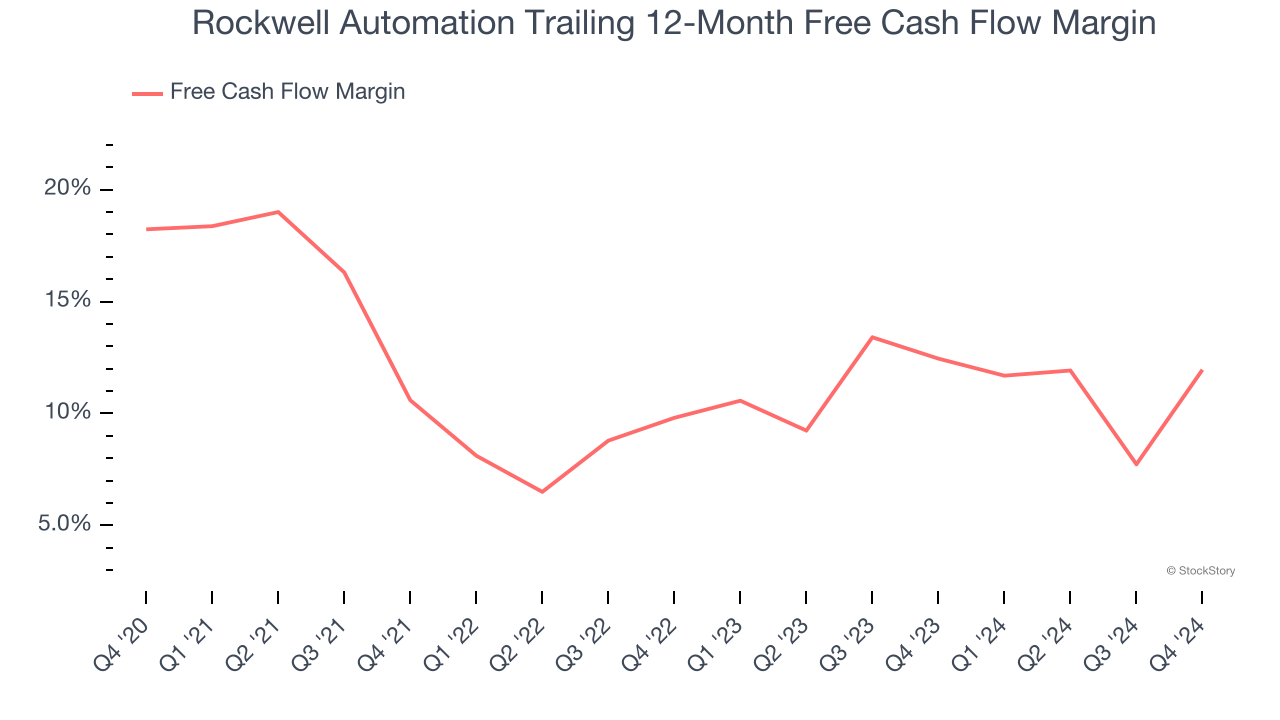
2. Free Cash Flow Margin Dropping
Free cash flow isn't a prominently featured metric in company financials and earnings releases, but we think it's telling because it accounts for all operating and capital expenses, making it tough to manipulate. Cash is king.
As you can see below, Rockwell Automation’s margin dropped by 6.3 percentage points over the last five years. If its declines continue, it could signal higher capital intensity and investment needs. Rockwell Automation’s free cash flow margin for the trailing 12 months was 12%.
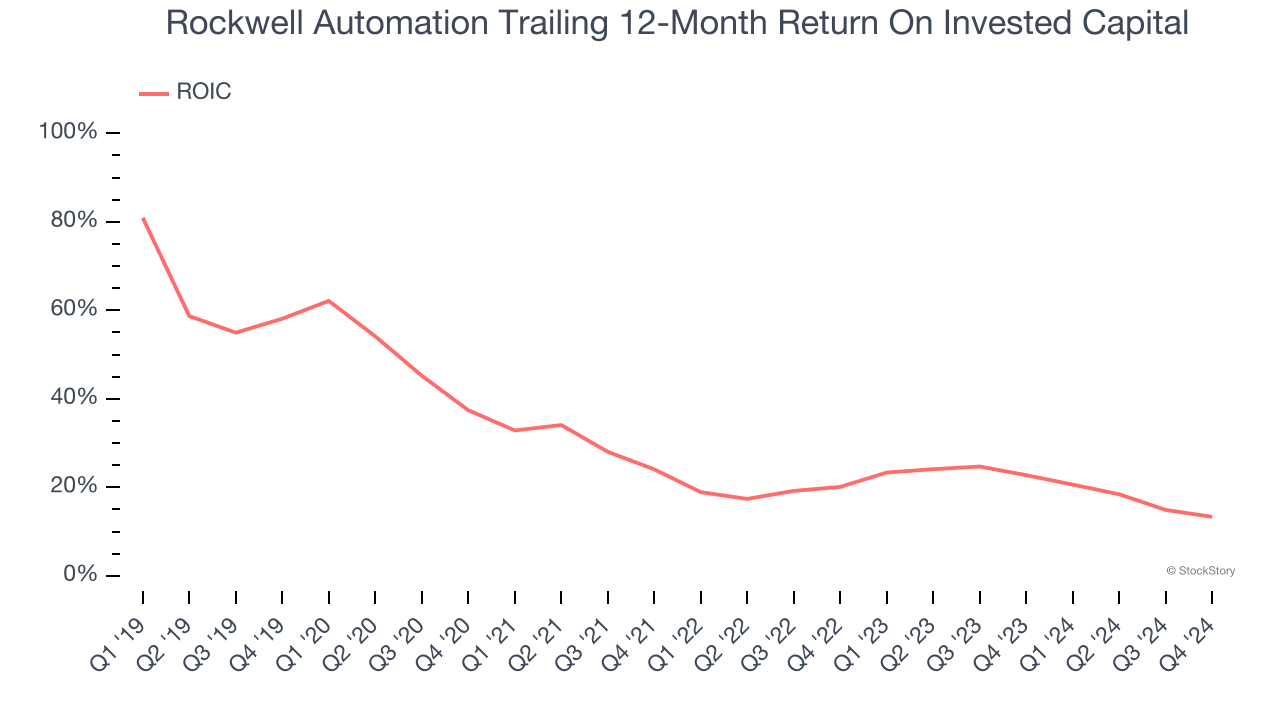
3. New Investments Fail to Bear Fruit as ROIC Declines
ROIC, or return on invested capital, is a metric showing how much operating profit a company generates relative to the money it has raised (debt and equity).
We like to invest in businesses with high returns, but the trend in a company’s ROIC is what often surprises the market and moves the stock price. Unfortunately, Rockwell Automation’s ROIC has decreased significantly over the last few years. We like what management has done in the past, but its declining returns are perhaps a symptom of fewer profitable growth opportunities.
Final Judgment
Rockwell Automation falls short of our quality standards. That said, the stock currently trades at 27.7× forward price-to-earnings (or $274.49 per share). This valuation tells us a lot of optimism is priced in - we think there are better stocks to buy right now. We’d suggest looking at one of Charlie Munger’s all-time favorite businesses.
Stocks We Like More Than Rockwell Automation
The Trump trade may have passed, but rates are still dropping and inflation is still cooling. Opportunities are ripe for those ready to act - and we’re here to help you pick them.
Get started by checking out our Top 5 Strong Momentum Stocks for this week. This is a curated list of our High Quality stocks that have generated a market-beating return of 175% over the last five years.
Stocks that made our list in 2019 include now familiar names such as Nvidia (+2,183% between December 2019 and December 2024) as well as under-the-radar businesses like Sterling Infrastructure (+1,096% five-year return). Find your next big winner with StockStory today for free.


