
FTAI Infrastructure has gotten torched over the last six months - since October 2024, its stock price has dropped 57.9% to $3.79 per share. This was partly driven by its softer quarterly results and may have investors wondering how to approach the situation.
Is now the time to buy FTAI Infrastructure, or should you be careful about including it in your portfolio? See what our analysts have to say in our full research report, it’s free.
Despite the more favorable entry price, we're swiping left on FTAI Infrastructure for now. Here are three reasons why you should be careful with FIP and a stock we'd rather own.
Why Is FTAI Infrastructure Not Exciting?
Spun off from FTAI Aviation in 2021, FTAI Infrastructure (NASDAQ: FIP) invests in and operates infrastructure and related assets across the transportation and energy sectors.
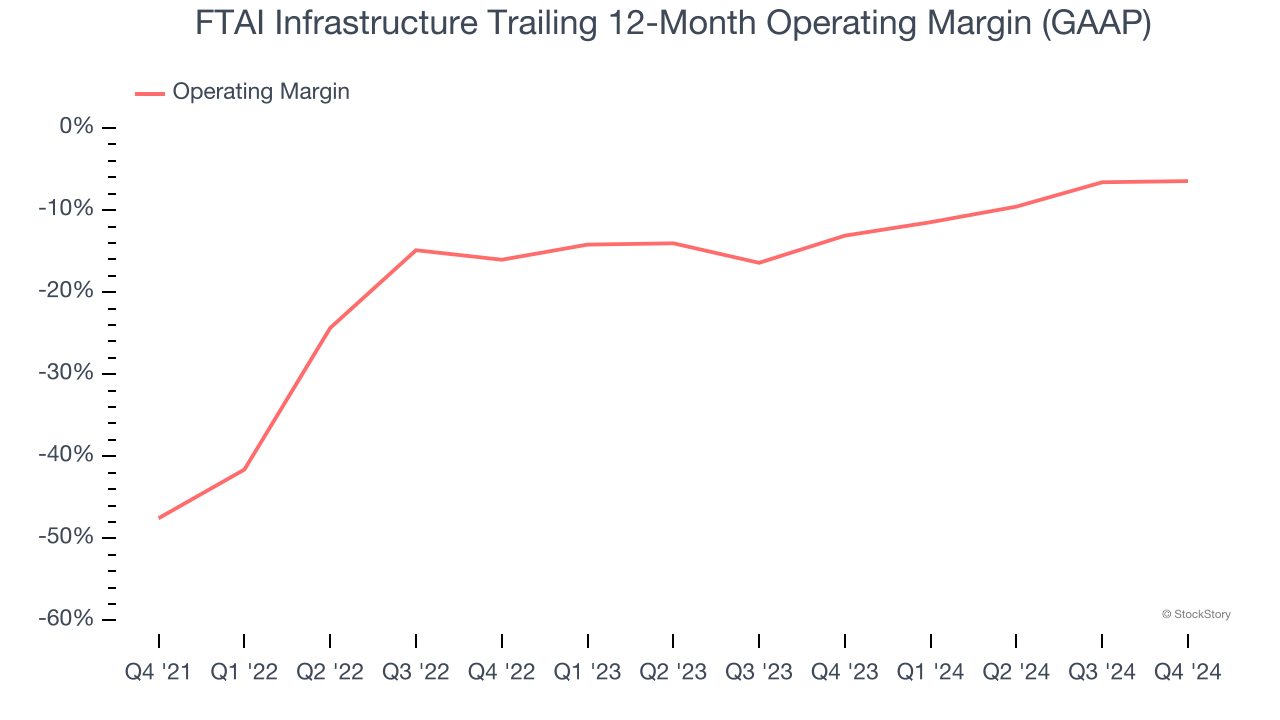
1. Operating Losses Sound the Alarms
Operating margin is a key measure of profitability. Think of it as net income - the bottom line - excluding the impact of taxes and interest on debt, which are less connected to business fundamentals.
FTAI Infrastructure’s high expenses have contributed to an average operating margin of negative 15.7% over the last four years. Unprofitable industrials companies require extra attention because they could get caught swimming naked when the tide goes out. It’s hard to trust that the business can endure a full cycle.
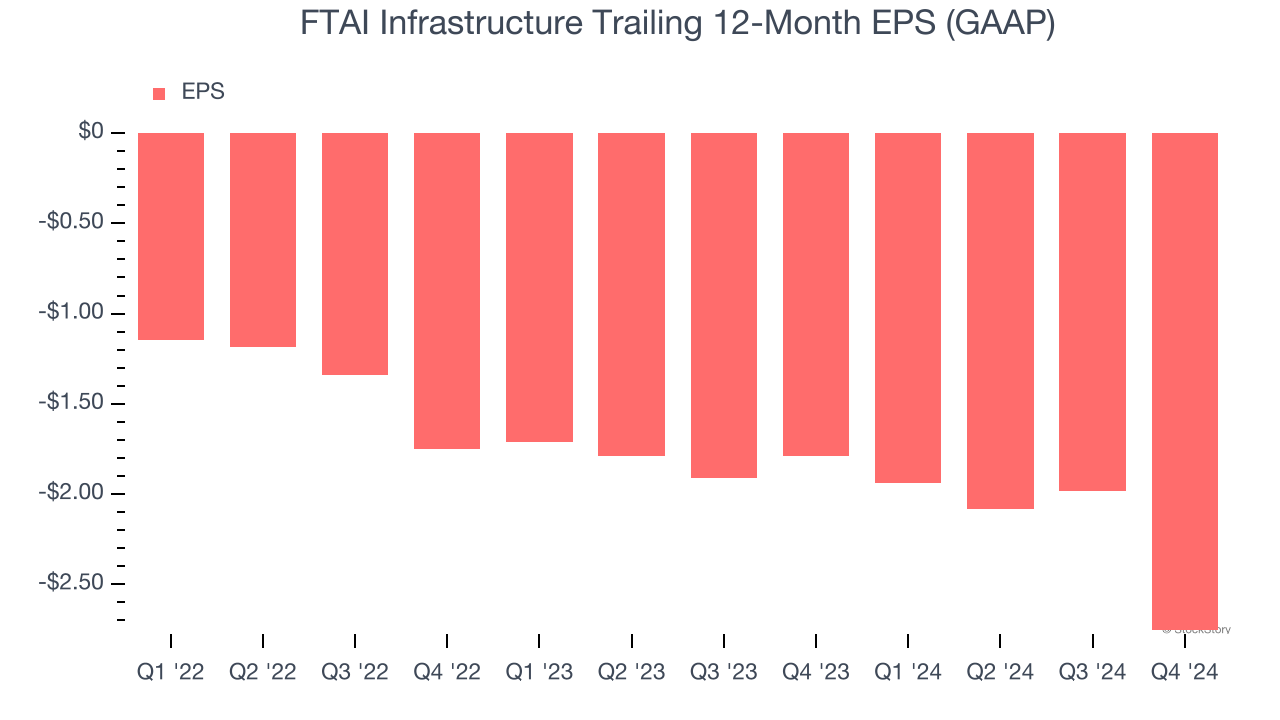
2. EPS Trending Down
We track the change in earnings per share (EPS) because it highlights whether a company’s growth is profitable.
FTAI Infrastructure’s earnings losses deepened over the last three years as its EPS dropped 45.7% annually. We’ll keep a close eye on the company as diminishing earnings could imply changing secular trends and preferences.
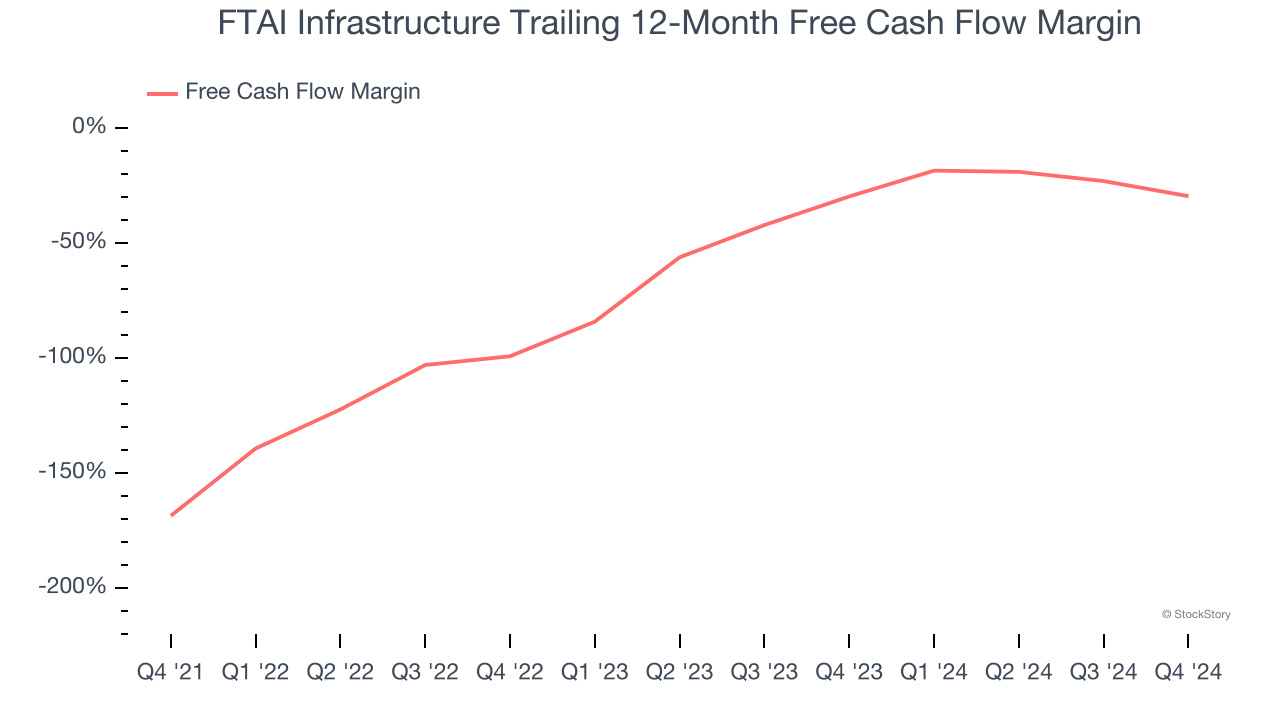
3. Cash Burn Ignites Concerns
If you’ve followed StockStory for a while, you know we emphasize free cash flow. Why, you ask? We believe that in the end, cash is king, and you can’t use accounting profits to pay the bills.
FTAI Infrastructure’s demanding reinvestments have drained its resources over the last four years, putting it in a pinch and limiting its ability to return capital to investors. Its free cash flow margin averaged negative 63.4%, meaning it lit $63.41 of cash on fire for every $100 in revenue.
Final Judgment
FTAI Infrastructure isn’t a terrible business, but it doesn’t pass our quality test. After the recent drawdown, the stock trades at 1.9× forward EV-to-EBITDA (or $3.79 per share). This valuation is reasonable, but the company’s shakier fundamentals present too much downside risk. We're pretty confident there are more exciting stocks to buy at the moment. We’d recommend looking at our favorite semiconductor picks and shovels play.
Stocks We Like More Than FTAI Infrastructure
Donald Trump’s victory in the 2024 U.S. Presidential Election sent major indices to all-time highs, but stocks have retraced as investors debate the health of the economy and the potential impact of tariffs.
While this leaves much uncertainty around 2025, a few companies are poised for long-term gains regardless of the political or macroeconomic climate, like our Top 6 Stocks for this week. This is a curated list of our High Quality stocks that have generated a market-beating return of 175% over the last five years.
Stocks that made our list in 2019 include now familiar names such as Nvidia (+2,183% between December 2019 and December 2024) as well as under-the-radar businesses like Sterling Infrastructure (+1,096% five-year return). Find your next big winner with StockStory today for free.


