
3D measurement and imaging company FARO (NASDAQ: FARO) reported Q1 CY2025 results exceeding the market’s revenue expectations, but sales fell by 1.6% year on year to $82.86 million. The company expects next quarter’s revenue to be around $83 million, close to analysts’ estimates. Its non-GAAP profit of $0.33 per share was significantly above analysts’ consensus estimates.
Is now the time to buy FARO? Find out by accessing our full research report, it’s free.
FARO (FARO) Q1 CY2025 Highlights:
- Revenue: $82.86 million vs analyst estimates of $80.25 million (1.6% year-on-year decline, 3.3% beat)
- Adjusted EPS: $0.33 vs analyst estimates of $0.16 (significant beat)
- Adjusted EBITDA: $12.47 million vs analyst estimates of $7.78 million (15% margin, 60.2% beat)
- Revenue Guidance for Q2 CY2025 is $83 million at the midpoint, roughly in line with what analysts were expecting
- Adjusted EPS guidance for Q2 CY2025 is $0.30 at the midpoint, above analyst estimates of $0.20
- Operating Margin: 4.6%, up from -6.3% in the same quarter last year
- Free Cash Flow Margin: 2.7%, down from 6.2% in the same quarter last year
- Market Capitalization: $507.6 million
“We’re very pleased with our strong start to the year, with our first quarter financial results exceeding our expectations and reflecting the successful execution of our strategic growth initiatives,” said Peter Lau, President & Chief Executive Officer.
Company Overview
Launched by two PhD students in a garage, FARO (NASDAQ: FARO) provides 3D measurement and imaging systems for the manufacturing, construction, engineering, and public safety industries.
Inspection Instruments
Measurement and inspection instrument companies may enjoy more steady demand because products such as water meters are non-discretionary and mandated for replacement at predictable intervals. In the last decade, digitization and data collection have driven innovation in the space, leading to incremental sales. But like the broader industrials sector, measurement and inspection instrument companies are at the whim of economic cycles. Interest rates, for example, can greatly impact civil, commercial, and residential construction projects that drive demand.
Sales Growth
Examining a company’s long-term performance can provide clues about its quality. Any business can experience short-term success, but top-performing ones enjoy sustained growth for years. FARO struggled to consistently generate demand over the last five years as its sales dropped at a 1.5% annual rate. This was below our standards and is a sign of lacking business quality.
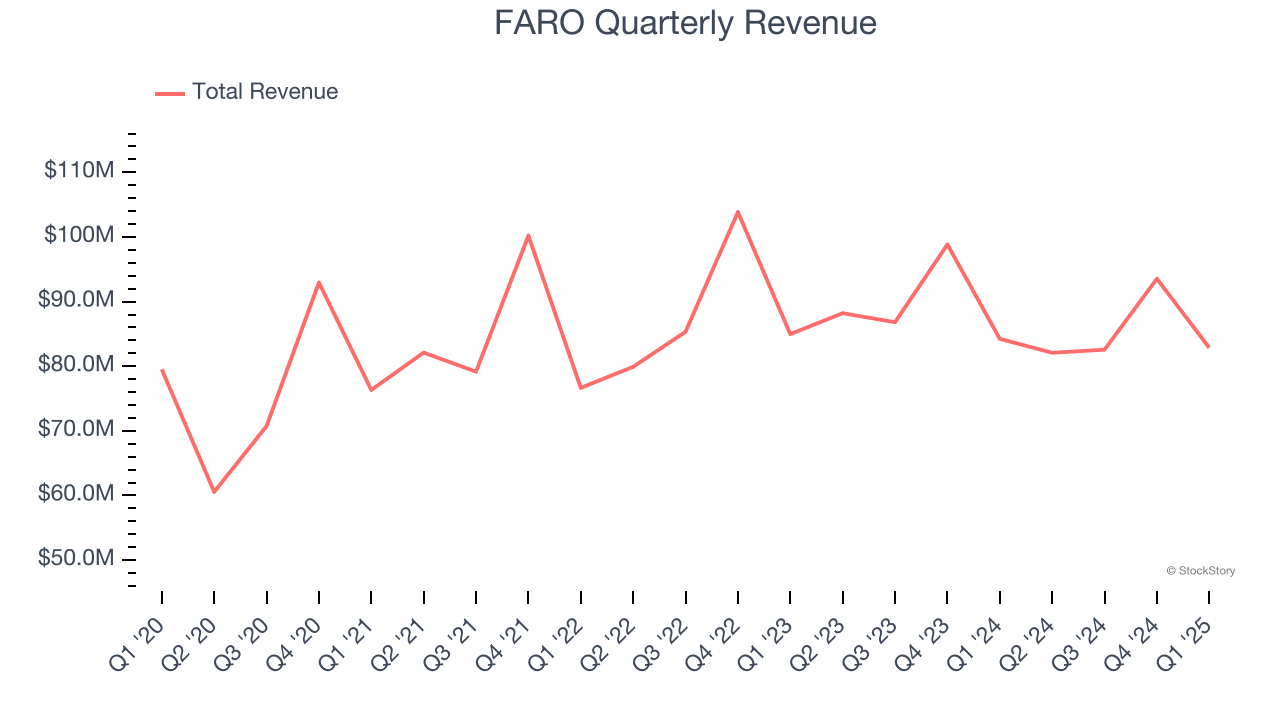
Long-term growth is the most important, but within industrials, a half-decade historical view may miss new industry trends or demand cycles. FARO’s annualized revenue declines of 1.9% over the last two years align with its five-year trend, suggesting its demand has consistently shrunk. 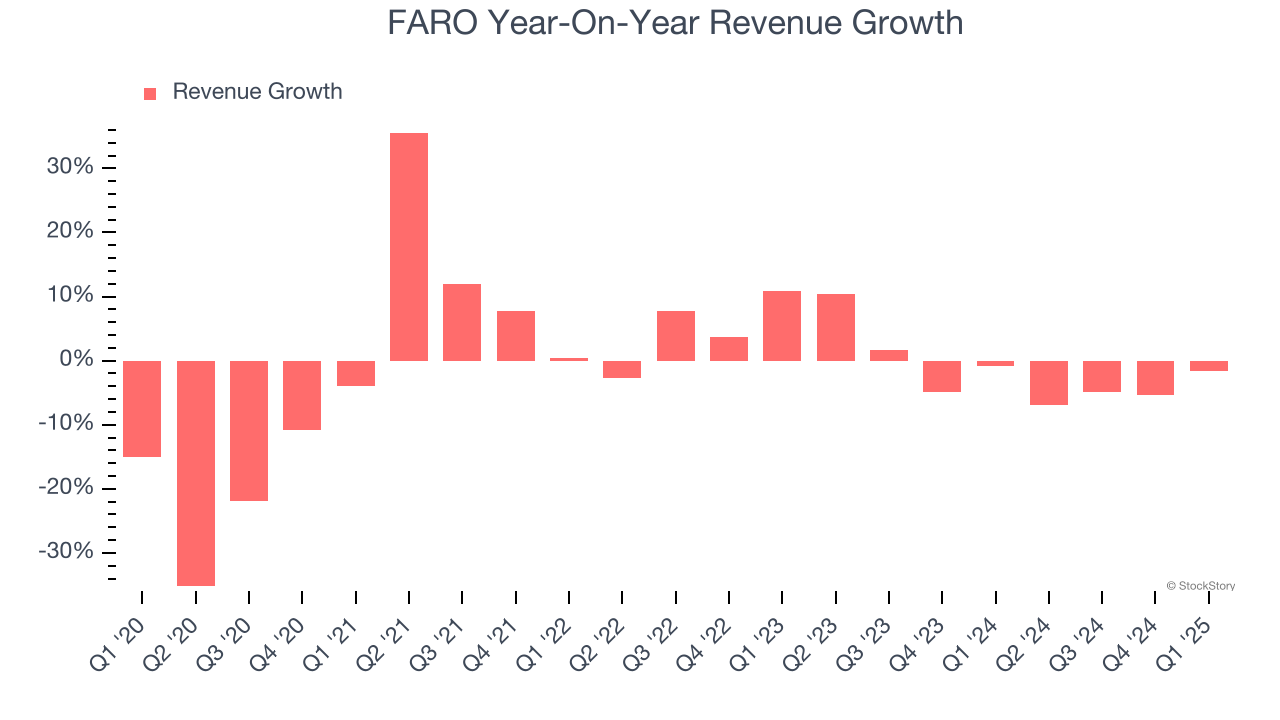
This quarter, FARO’s revenue fell by 1.6% year on year to $82.86 million but beat Wall Street’s estimates by 3.3%. Company management is currently guiding for a 1.1% year-on-year increase in sales next quarter.
Looking further ahead, sell-side analysts expect revenue to grow 2.3% over the next 12 months. Although this projection implies its newer products and services will spur better top-line performance, it is still below average for the sector.
Software is eating the world and there is virtually no industry left that has been untouched by it. That drives increasing demand for tools helping software developers do their jobs, whether it be monitoring critical cloud infrastructure, integrating audio and video functionality, or ensuring smooth content streaming. Click here to access a free report on our 3 favorite stocks to play this generational megatrend.
Operating Margin
Although FARO was profitable this quarter from an operational perspective, it’s generally struggled over a longer time period. Its expensive cost structure has contributed to an average operating margin of negative 2.8% over the last five years. Unprofitable industrials companies require extra attention because they could get caught swimming naked when the tide goes out. It’s hard to trust that the business can endure a full cycle.
On the plus side, FARO’s operating margin rose by 10.2 percentage points over the last five years. Still, it will take much more for the company to show consistent profitability.
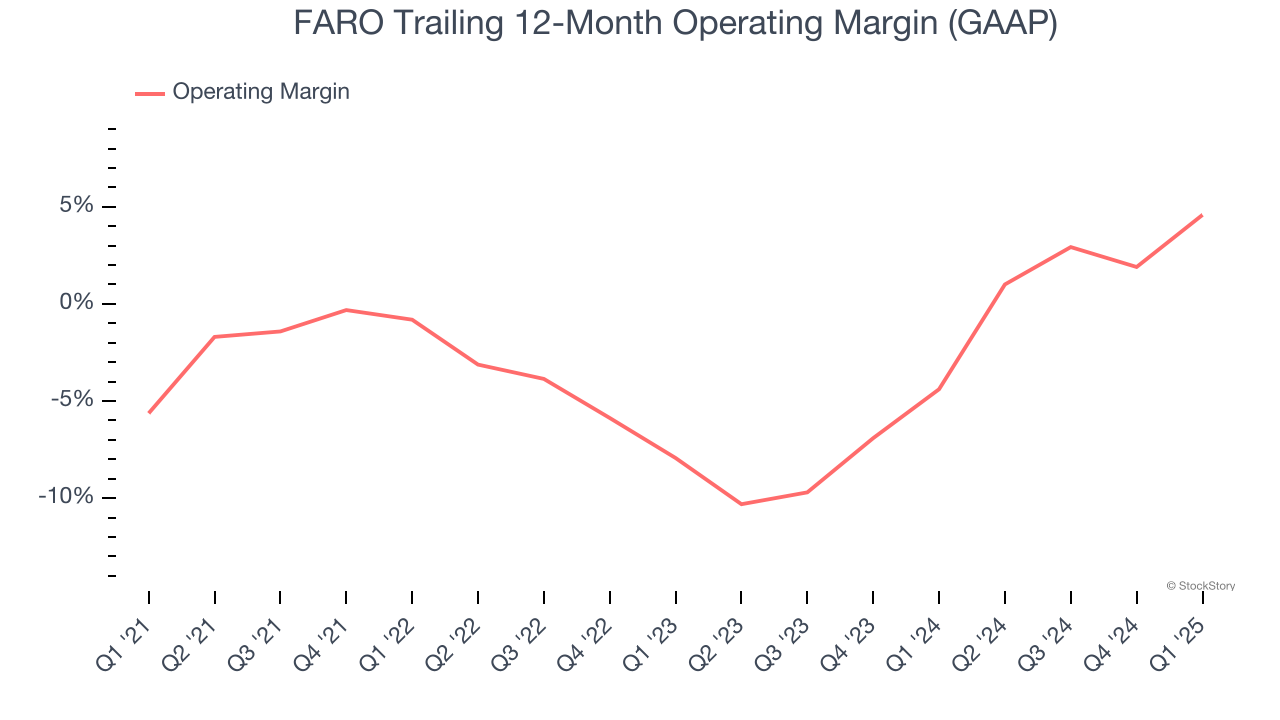
In Q1, FARO generated an operating profit margin of 4.6%, up 10.9 percentage points year on year. The increase was solid, and because its operating margin rose more than its gross margin, we can infer it was more efficient with expenses such as marketing, R&D, and administrative overhead.
Earnings Per Share
Revenue trends explain a company’s historical growth, but the long-term change in earnings per share (EPS) points to the profitability of that growth – for example, a company could inflate its sales through excessive spending on advertising and promotions.
FARO’s EPS grew at an astounding 33.3% compounded annual growth rate over the last five years, higher than its 1.5% annualized revenue declines. This tells us management adapted its cost structure in response to a challenging demand environment.
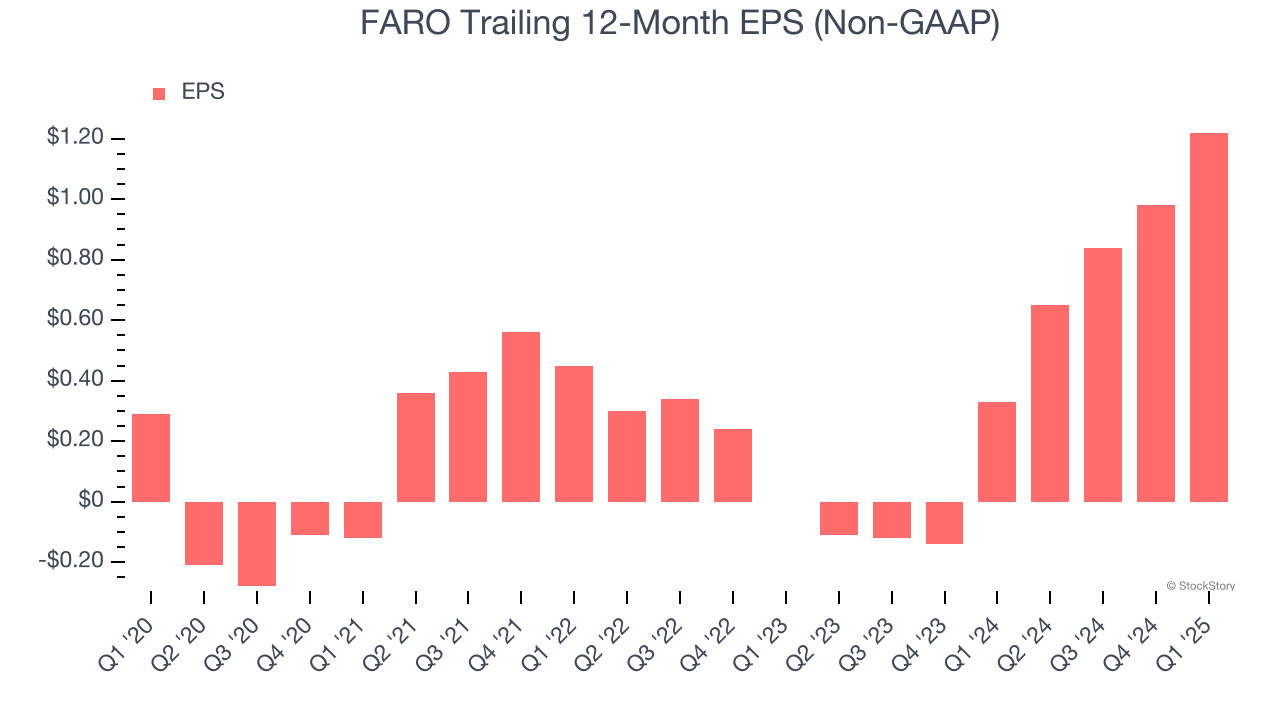
We can take a deeper look into FARO’s earnings to better understand the drivers of its performance. As we mentioned earlier, FARO’s operating margin expanded by 10.2 percentage points over the last five years. This was the most relevant factor (aside from the revenue impact) behind its higher earnings; taxes and interest expenses can also affect EPS but don’t tell us as much about a company’s fundamentals.
Like with revenue, we analyze EPS over a shorter period to see if we are missing a change in the business.
For FARO, its one-year annual EPS growth of 270% was higher than its five-year trend. We love it when earnings growth accelerates, especially when it accelerates off an already high base.
In Q1, FARO reported EPS at $0.33, up from $0.09 in the same quarter last year. This print easily cleared analysts’ estimates, and shareholders should be content with the results. Over the next 12 months, Wall Street expects FARO’s full-year EPS of $1.22 to shrink by 9%.
Key Takeaways from FARO’s Q1 Results
We were impressed by FARO’s optimistic EPS guidance for next quarter, which blew past analysts’ expectations. We were also excited its revenue, EPS, and EBITDA outperformed Wall Street’s estimates. Zooming out, we think this quarter featured some important positives. The stock traded up 13.6% to $30 immediately following the results.
FARO put up rock-solid earnings, but one quarter doesn’t necessarily make the stock a buy. Let’s see if this is a good investment. If you’re making that decision, you should consider the bigger picture of valuation, business qualities, as well as the latest earnings. We cover that in our actionable full research report which you can read here, it’s free.


