
Since April 2020, the S&P 500 has delivered a total return of 87.2%. But one standout stock has nearly doubled the market - over the past five years, Cardinal Health has surged 159% to $127.74 per share. Its momentum hasn’t stopped as it’s also gained 13.4% in the last six months thanks to its solid quarterly results, beating the S&P by 23.9%.
Is it too late to buy CAH? Find out in our full research report, it’s free.
Why Does Cardinal Health Spark Debate?
Operating as a critical link in the healthcare supply chain since 1979, Cardinal Health (NYSE: CAH) distributes pharmaceuticals and manufactures medical products for hospitals, pharmacies, and healthcare providers across the global healthcare supply chain.
Two Positive Attributes:
1. Economies of Scale Give It Negotiating Leverage with Suppliers
Larger companies benefit from economies of scale, where fixed costs like infrastructure, technology, and administration are spread over a higher volume of goods or services, reducing the cost per unit. Scale can also lead to bargaining power with suppliers, greater brand recognition, and more investment firepower. A virtuous cycle can ensue if a scaled company plays its cards right.
With $222.3 billion in revenue over the past 12 months, Cardinal Health is one of the most scaled enterprises in healthcare. This is particularly important because healthcare distribution & related services companies are volume-driven businesses due to their low margins.
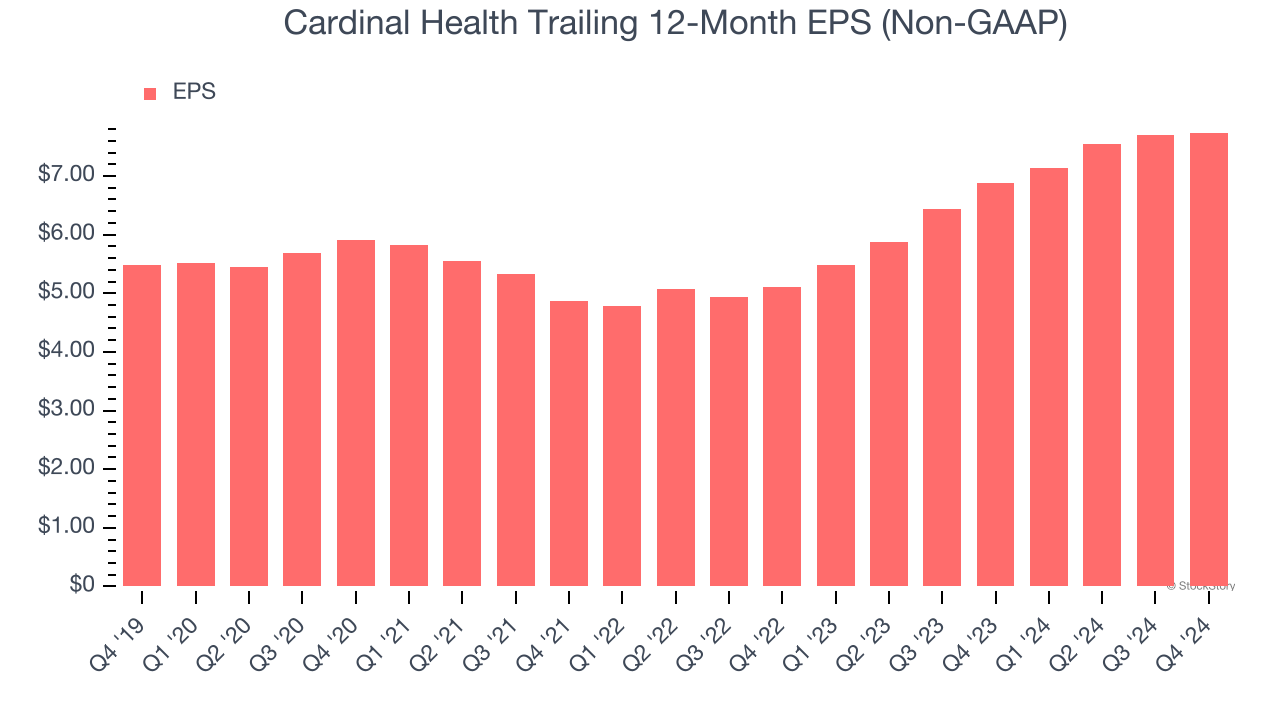
2. EPS Increasing Steadily
We track the long-term change in earnings per share (EPS) because it highlights whether a company’s growth is profitable.
Cardinal Health’s EPS grew at a solid 7.1% compounded annual growth rate over the last five years. This performance was better than most healthcare businesses.
One Reason to be Careful:
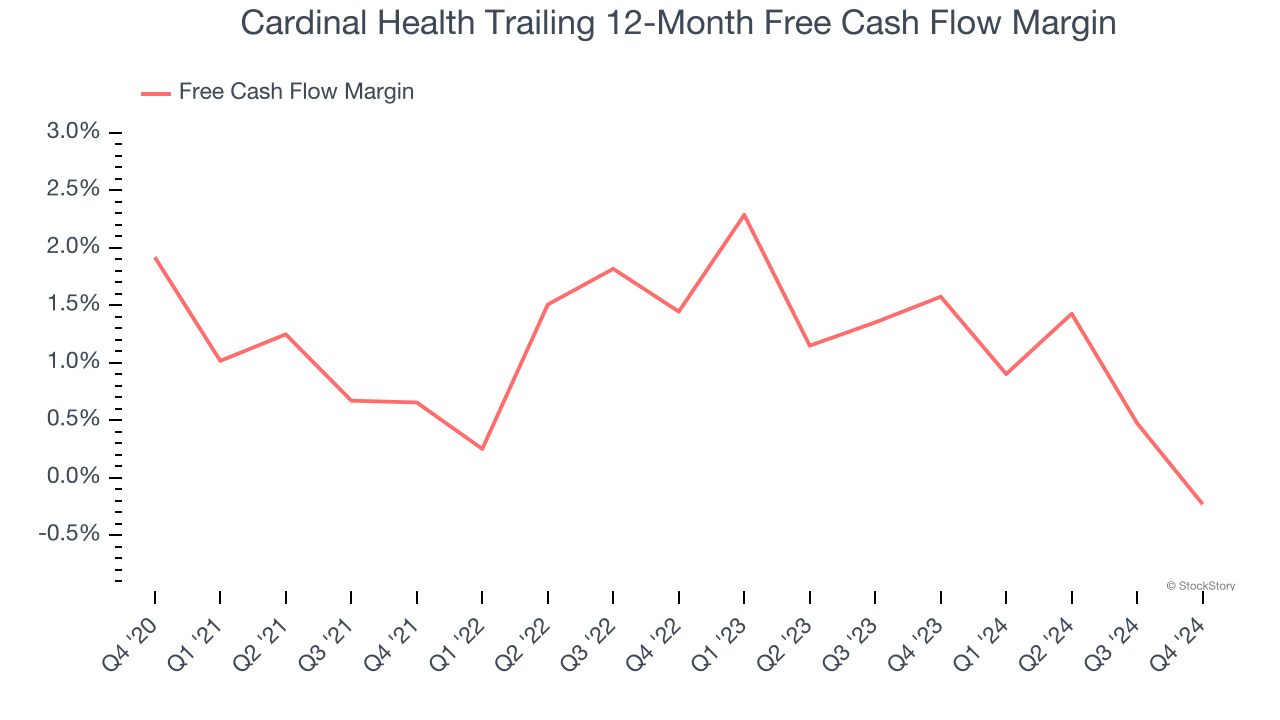
Mediocre Free Cash Flow Margin Limits Reinvestment Potential
Free cash flow isn't a prominently featured metric in company financials and earnings releases, but we think it's telling because it accounts for all operating and capital expenses, making it tough to manipulate. Cash is king.
Cardinal Health has shown mediocre cash profitability over the last five years, giving the company limited opportunities to return capital to shareholders. Its free cash flow margin averaged 1%, subpar for a healthcare business.
Final Judgment
Cardinal Health has huge potential even though it has some open questions, and with its shares outperforming the market lately, the stock trades at 15.2× forward price-to-earnings (or $127.74 per share). Is now a good time to initiate a position? See for yourself in our comprehensive research report, it’s free.
Stocks We Like Even More Than Cardinal Health
Market indices reached historic highs following Donald Trump’s presidential victory in November 2024, but the outlook for 2025 is clouded by new trade policies that could impact business confidence and growth.
While this has caused many investors to adopt a "fearful" wait-and-see approach, we’re leaning into our best ideas that can grow regardless of the political or macroeconomic climate. Take advantage of Mr. Market by checking out our Top 5 Strong Momentum Stocks for this week. This is a curated list of our High Quality stocks that have generated a market-beating return of 175% over the last five years.
Stocks that made our list in 2019 include now familiar names such as Nvidia (+2,183% between December 2019 and December 2024) as well as under-the-radar businesses like Sterling Infrastructure (+1,096% five-year return). Find your next big winner with StockStory today for free.


