
Slot machine and terminal operator Accel Entertainment (NYSE: ACEL) announced better-than-expected revenue in Q1 CY2025, with sales up 7.3% year on year to $323.9 million. Its GAAP profit of $0.17 per share was 43.6% above analysts’ consensus estimates.
Is now the time to buy Accel Entertainment? Find out by accessing our full research report, it’s free.
Accel Entertainment (ACEL) Q1 CY2025 Highlights:
- Revenue: $323.9 million vs analyst estimates of $318.8 million (7.3% year-on-year growth, 1.6% beat)
- EPS (GAAP): $0.17 vs analyst estimates of $0.12 (43.6% beat)
- Adjusted EBITDA: $49.51 million vs analyst estimates of $48.06 million (15.3% margin, 3% beat)
- Operating Margin: 8%, in line with the same quarter last year
- Video Gaming Terminals Sold: 27,180, up 1,859 year on year
- Market Capitalization: $901.3 million
Accel CEO Andy Rubenstein commented, “Our operating and financial momentum continues in 2025. In the first quarter, we generated our highest quarterly revenue since going public and strong Adjusted EBITDA as we expanded the number of locations we serve and increased the number of gaming terminals. In April, we opened Phase I of our casino and commenced horse racing operations at Fairmount Park Casino & Racing, which has already garnered solid customer visitation and play. This past Saturday, we hosted Fairmount Park’s “Derby Day at the Track.”
Company Overview
Established in Illinois, Accel Entertainment (NYSE: ACEL) is a provider of electronic gaming machines and interactive amusement terminals to bars and entertainment venues.
Sales Growth
A company’s long-term performance is an indicator of its overall quality. Any business can put up a good quarter or two, but many enduring ones grow for years. Thankfully, Accel Entertainment’s 23.6% annualized revenue growth over the last five years was impressive. Its growth beat the average consumer discretionary company and shows its offerings resonate with customers.
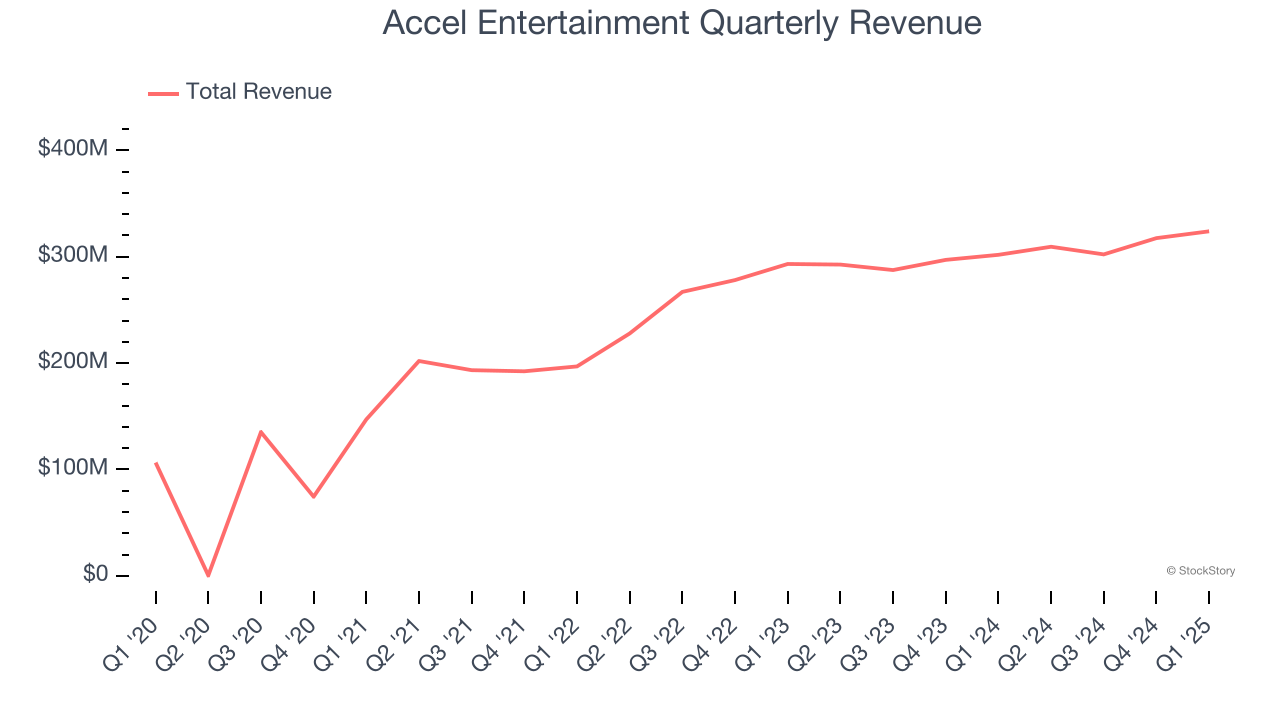
Long-term growth is the most important, but within consumer discretionary, product cycles are short and revenue can be hit-driven due to rapidly changing trends and consumer preferences. Accel Entertainment’s recent performance shows its demand has slowed significantly as its annualized revenue growth of 8.4% over the last two years was well below its five-year trend. 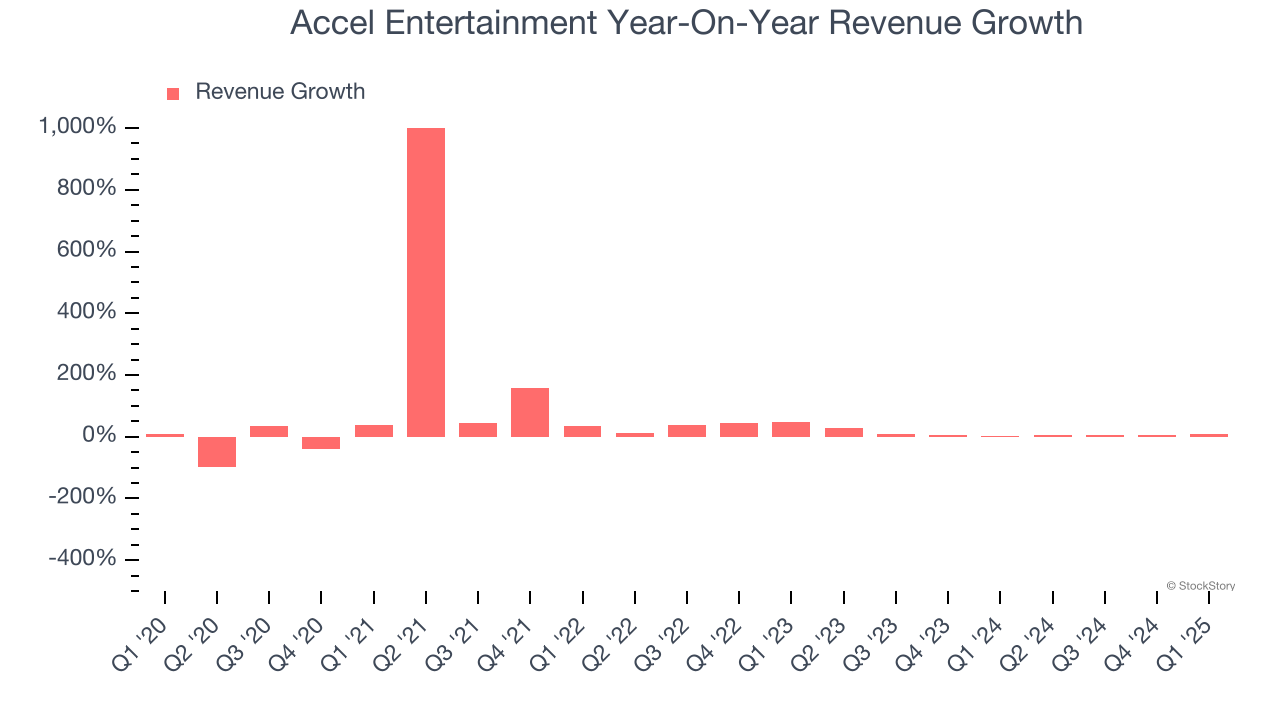
Accel Entertainment also discloses its number of video gaming terminals sold, which reached 27,180 in the latest quarter. Over the last two years, Accel Entertainment’s video gaming terminals sold averaged 6.8% year-on-year growth. Because this number is lower than its revenue growth during the same period, we can see the company’s monetization has risen. 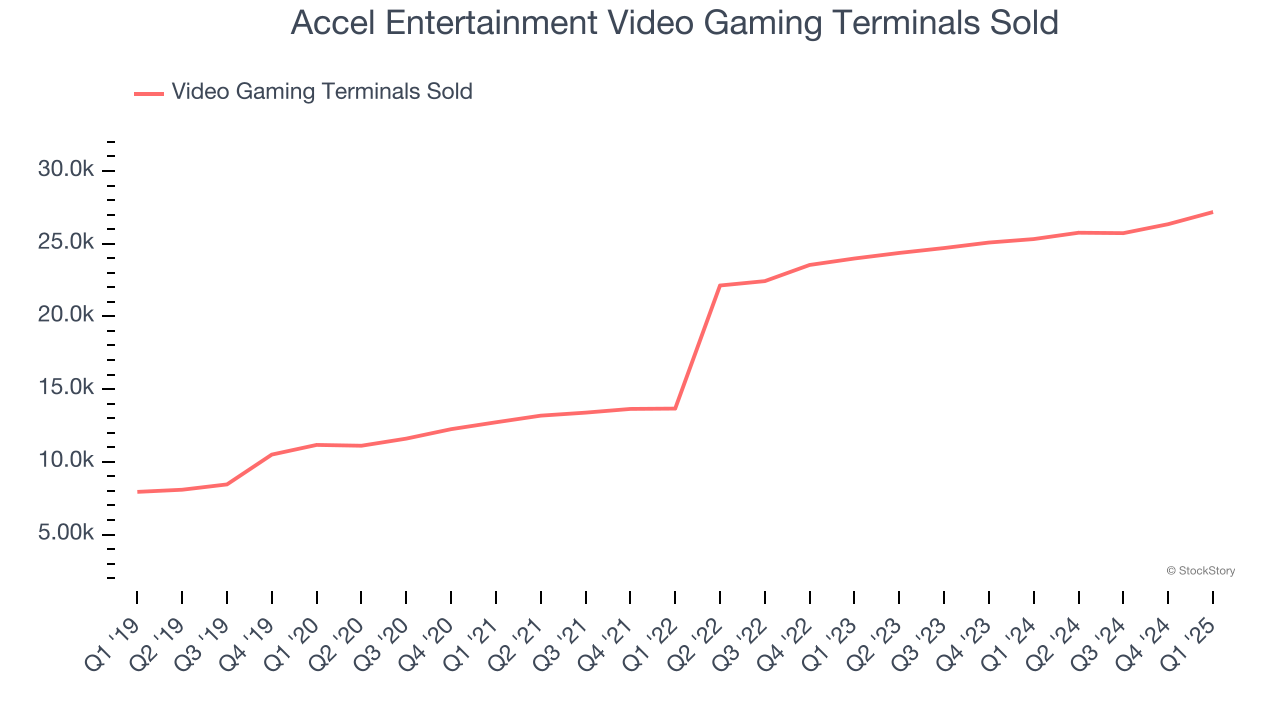
This quarter, Accel Entertainment reported year-on-year revenue growth of 7.3%, and its $323.9 million of revenue exceeded Wall Street’s estimates by 1.6%.
Looking ahead, sell-side analysts expect revenue to grow 5.4% over the next 12 months, a deceleration versus the last two years. This projection doesn't excite us and implies its products and services will see some demand headwinds.
Here at StockStory, we certainly understand the potential of thematic investing. Diverse winners from Microsoft (MSFT) to Alphabet (GOOG), Coca-Cola (KO) to Monster Beverage (MNST) could all have been identified as promising growth stories with a megatrend driving the growth. So, in that spirit, we’ve identified a relatively under-the-radar profitable growth stock benefiting from the rise of AI, available to you FREE via this link.
Operating Margin
Operating margin is a key measure of profitability. Think of it as net income - the bottom line - excluding the impact of taxes and interest on debt, which are less connected to business fundamentals.
Accel Entertainment’s operating margin has been trending down over the last 12 months and averaged 8.1% over the last two years. Although this result isn’t good, the company’s top-notch historical revenue growth suggests it ramped up investments to capture market share. We’ll keep a close eye to see if this strategy pays off.
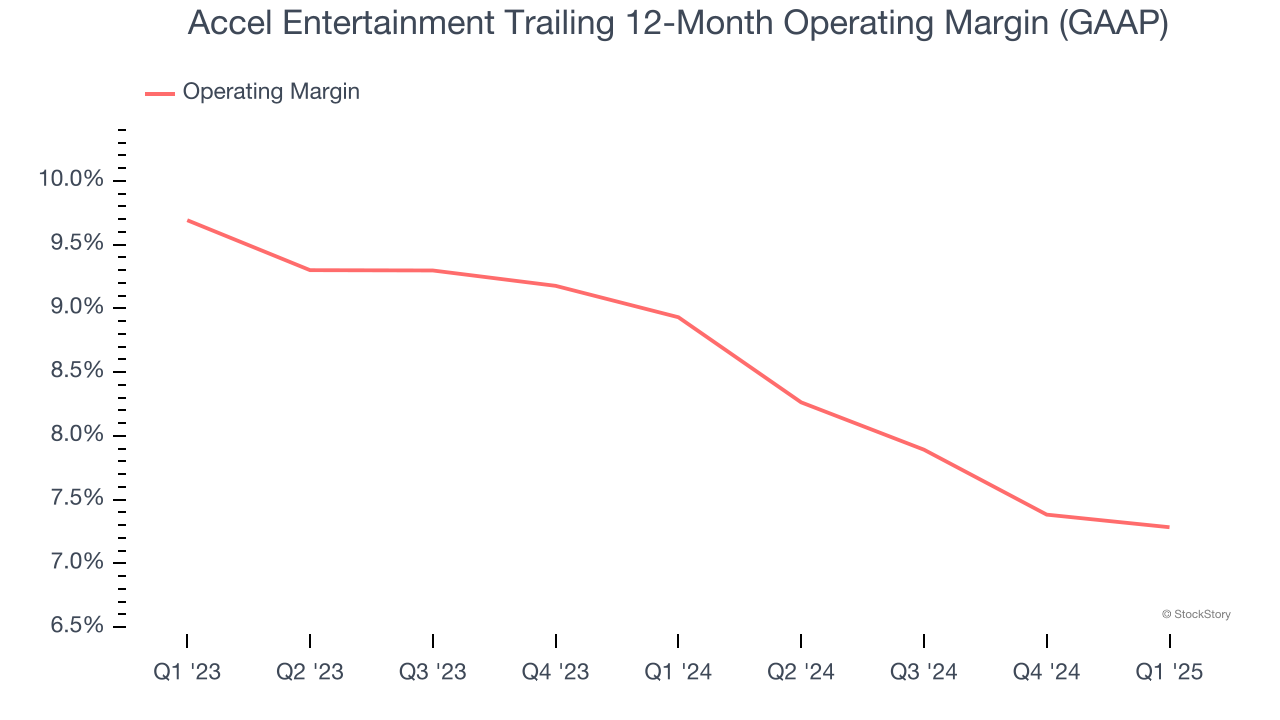
This quarter, Accel Entertainment generated an operating profit margin of 8%, in line with the same quarter last year. This indicates the company’s overall cost structure has been relatively stable.
Earnings Per Share
Revenue trends explain a company’s historical growth, but the long-term change in earnings per share (EPS) points to the profitability of that growth – for example, a company could inflate its sales through excessive spending on advertising and promotions.
Accel Entertainment’s spectacular 24.2% annual EPS growth over the last five years aligns with its revenue performance. This tells us its incremental sales were profitable.
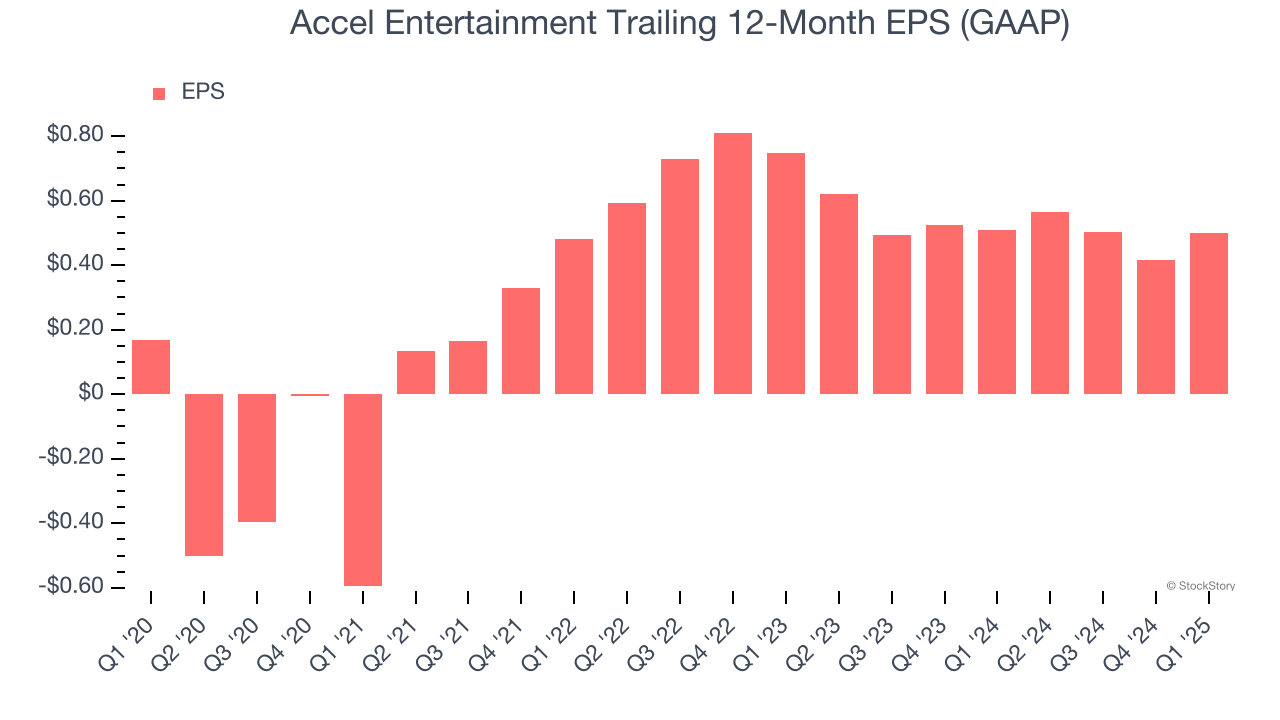
In Q1, Accel Entertainment reported EPS at $0.17, up from $0.09 in the same quarter last year. This print easily cleared analysts’ estimates, and shareholders should be content with the results. We also like to analyze expected EPS growth based on Wall Street analysts’ consensus projections, but there is insufficient data.
Key Takeaways from Accel Entertainment’s Q1 Results
We were impressed by how significantly Accel Entertainment blew past analysts’ EPS expectations this quarter. We were also glad its number of video gaming terminals sold outperformed Wall Street’s estimates. Overall, we think this was a solid quarter with some key areas of upside. The stock traded up 2.7% to $11.05 immediately following the results.
Indeed, Accel Entertainment had a rock-solid quarterly earnings result, but is this stock a good investment here? When making that decision, it’s important to consider its valuation, business qualities, as well as what has happened in the latest quarter. We cover that in our actionable full research report which you can read here, it’s free.