
Building products manufacturer JELD-WEN (NYSE: JELD) reported Q1 CY2025 results exceeding the market’s revenue expectations, but sales fell by 19.1% year on year to $776 million. Its non-GAAP loss of $0.17 per share was 10.2% above analysts’ consensus estimates.
Is now the time to buy JELD-WEN? Find out by accessing our full research report, it’s free.
JELD-WEN (JELD) Q1 CY2025 Highlights:
- Revenue: $776 million vs analyst estimates of $769.6 million (19.1% year-on-year decline, 0.8% beat)
- Adjusted EPS: -$0.17 vs analyst estimates of -$0.19 (10.2% beat)
- Adjusted EBITDA: $21.9 million vs analyst estimates of $20.76 million (2.8% margin, 5.5% beat)
- Operating Margin: -22.1%, down from -3% in the same quarter last year
- Free Cash Flow was -$120.3 million compared to -$45.7 million in the same quarter last year
- Organic Revenue fell 15% year on year (-13.5% in the same quarter last year)
- Market Capitalization: $492.6 million
"While market conditions remained very challenging during the first quarter, they developed mostly as expected," said Chief Executive Officer William J. Christensen.
Company Overview
Founded in the 1960s as a general wood-making company, JELD-WEN (NYSE: JELD) manufactures doors, windows, and other related building products.
Sales Growth
Reviewing a company’s long-term sales performance reveals insights into its quality. Any business can put up a good quarter or two, but the best consistently grow over the long haul. JELD-WEN’s demand was weak over the last five years as its sales fell at a 3.3% annual rate. This was below our standards and suggests it’s a low quality business.
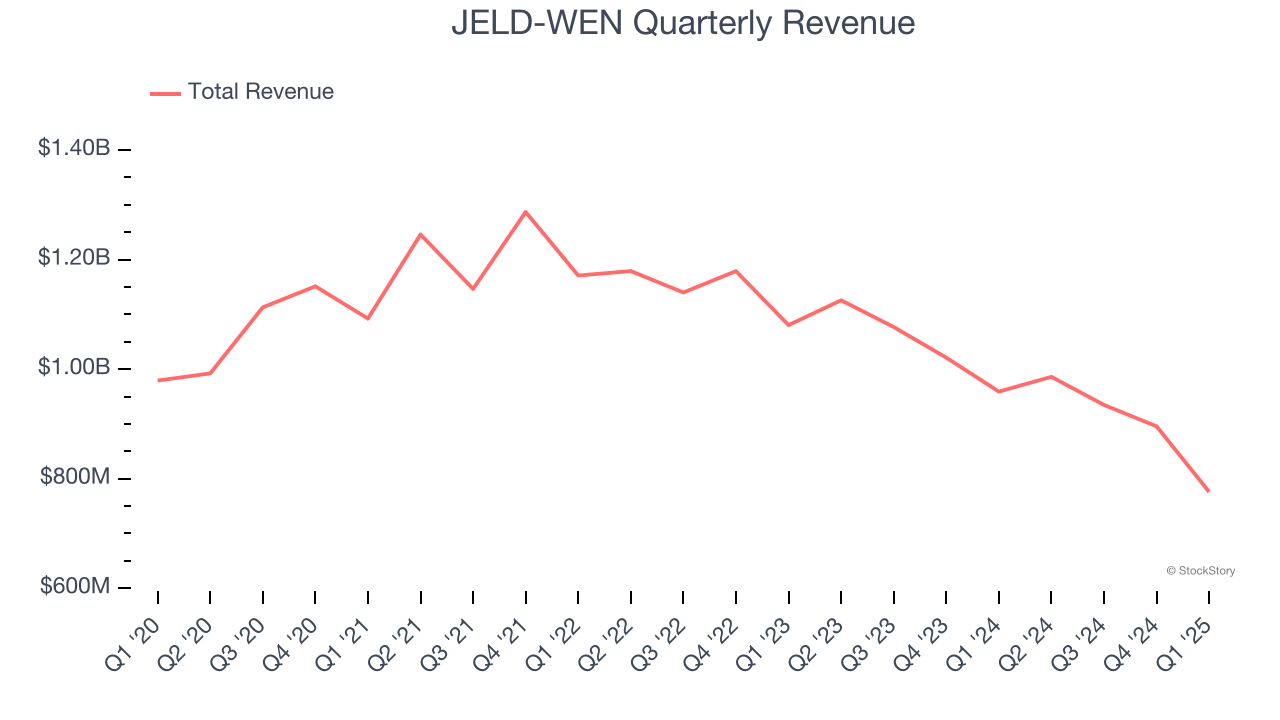
Long-term growth is the most important, but within industrials, a half-decade historical view may miss new industry trends or demand cycles. JELD-WEN’s recent performance shows its demand remained suppressed as its revenue has declined by 11.4% annually over the last two years. 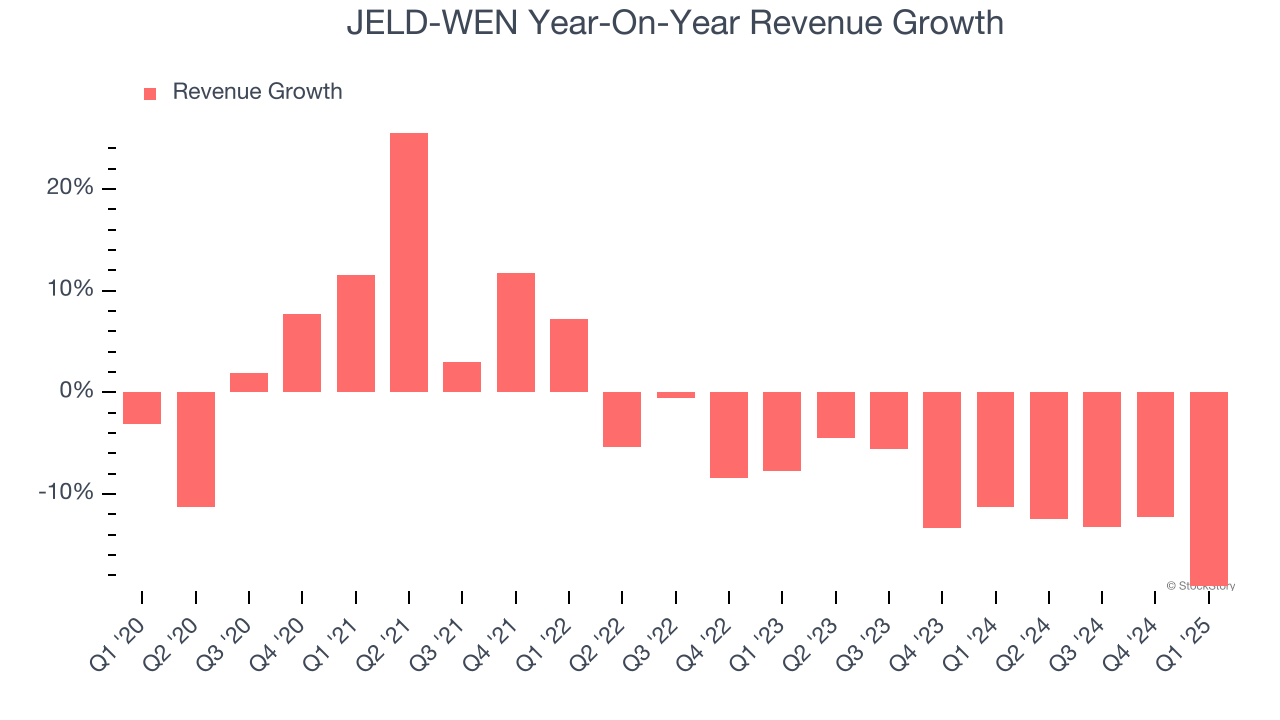
We can better understand the company’s sales dynamics by analyzing its organic revenue, which strips out one-time events like acquisitions and currency fluctuations that don’t accurately reflect its fundamentals. Over the last two years, JELD-WEN’s organic revenue averaged 12% year-on-year declines. Because this number aligns with its normal revenue growth, we can see the company’s core operations (not acquisitions and divestitures) drove most of its results. 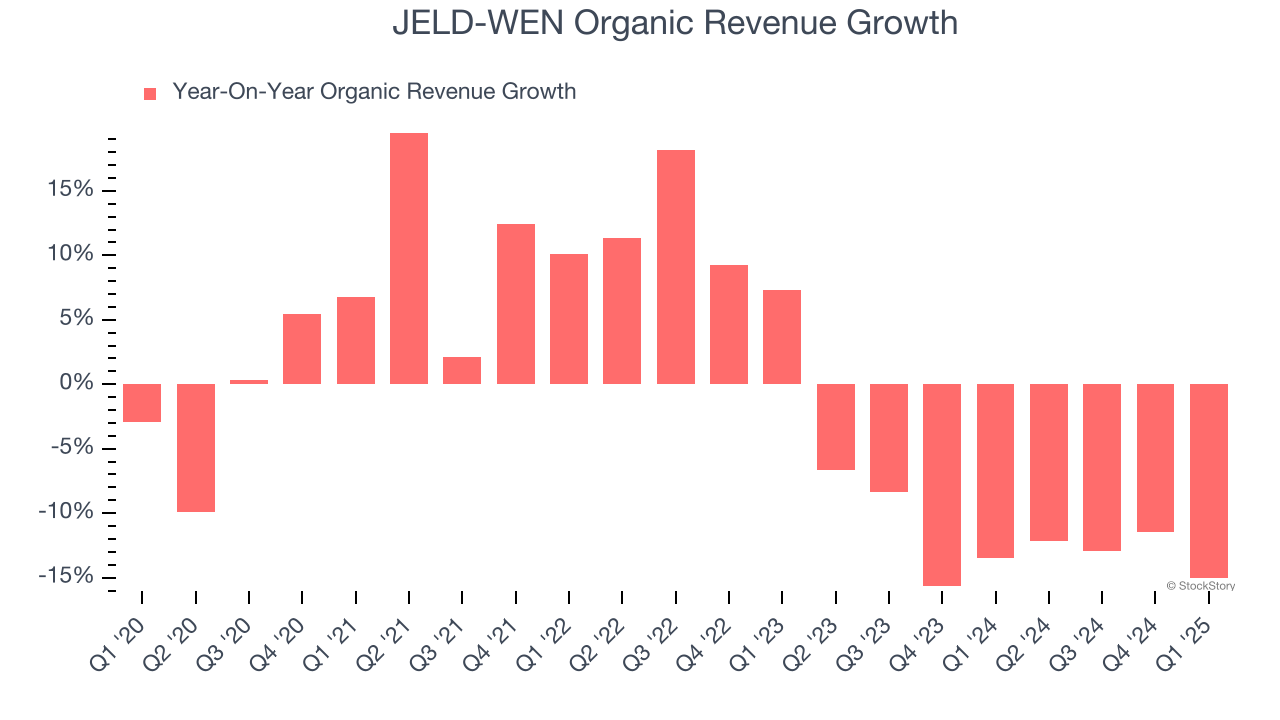
This quarter, JELD-WEN’s revenue fell by 19.1% year on year to $776 million but beat Wall Street’s estimates by 0.8%.
Looking ahead, sell-side analysts expect revenue to decline by 7.3% over the next 12 months. Although this projection is better than its two-year trend, it's hard to get excited about a company that is struggling with demand.
Today’s young investors won’t have read the timeless lessons in Gorilla Game: Picking Winners In High Technology because it was written more than 20 years ago when Microsoft and Apple were first establishing their supremacy. But if we apply the same principles, then enterprise software stocks leveraging their own generative AI capabilities may well be the Gorillas of the future. So, in that spirit, we are excited to present our Special Free Report on a profitable, fast-growing enterprise software stock that is already riding the automation wave and looking to catch the generative AI next.
Operating Margin
Operating margin is an important measure of profitability as it shows the portion of revenue left after accounting for all core expenses – everything from the cost of goods sold to advertising and wages. It’s also useful for comparing profitability across companies with different levels of debt and tax rates because it excludes interest and taxes.
JELD-WEN was profitable over the last five years but held back by its large cost base. Its average operating margin of 1.6% was weak for an industrials business. This result isn’t too surprising given its low gross margin as a starting point.
Analyzing the trend in its profitability, JELD-WEN’s operating margin decreased by 12.5 percentage points over the last five years. JELD-WEN’s performance was poor no matter how you look at it - it shows that costs were rising and it couldn’t pass them onto its customers.
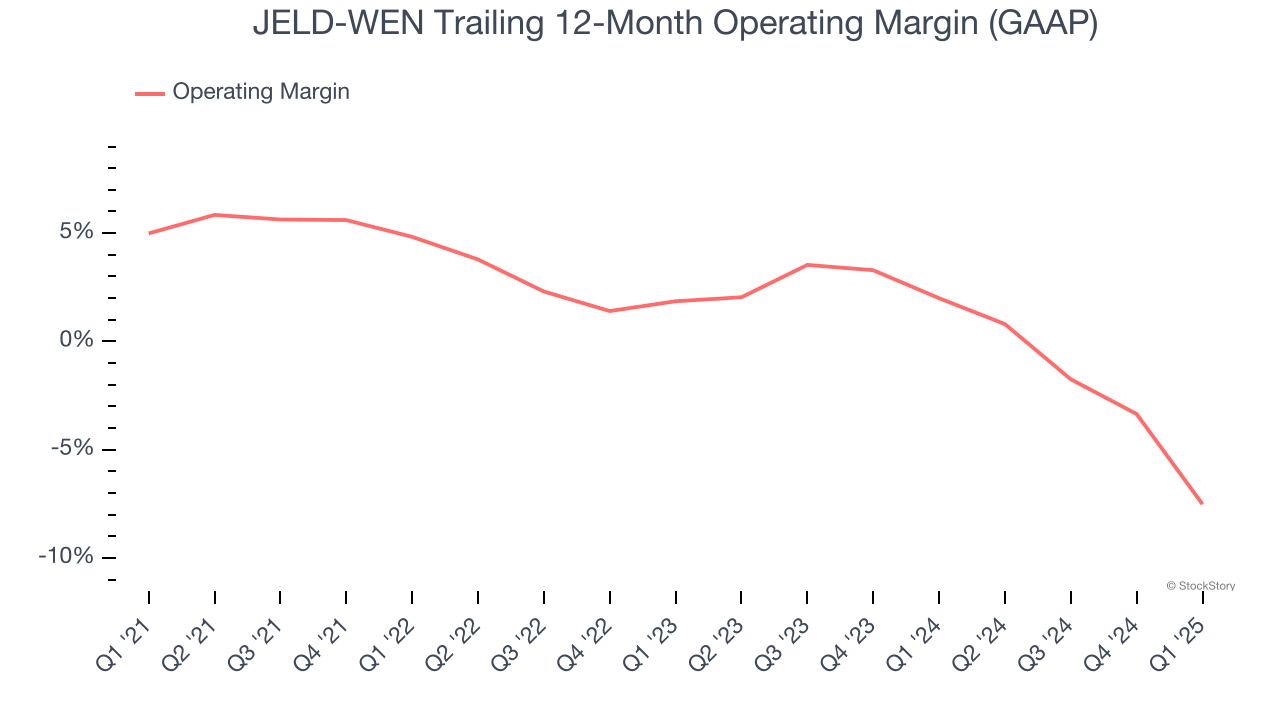
In Q1, JELD-WEN generated an operating profit margin of negative 22.1%, down 19.2 percentage points year on year. Since JELD-WEN’s operating margin decreased more than its gross margin, we can assume it was less efficient because expenses such as marketing, R&D, and administrative overhead increased.
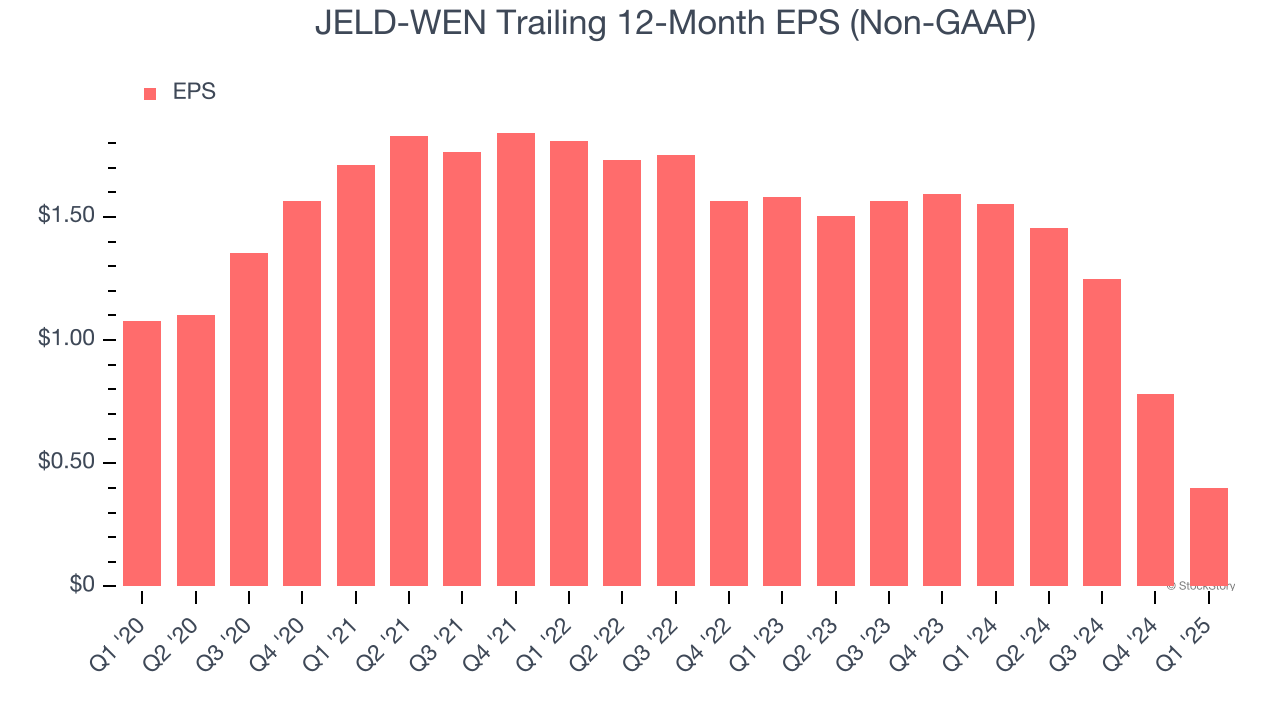
Earnings Per Share
We track the long-term change in earnings per share (EPS) for the same reason as long-term revenue growth. Compared to revenue, however, EPS highlights whether a company’s growth is profitable.
Sadly for JELD-WEN, its EPS declined by 18% annually over the last five years, more than its revenue. This tells us the company struggled because its fixed cost base made it difficult to adjust to shrinking demand.
Diving into the nuances of JELD-WEN’s earnings can give us a better understanding of its performance. As we mentioned earlier, JELD-WEN’s operating margin declined by 12.5 percentage points over the last five years. This was the most relevant factor (aside from the revenue impact) behind its lower earnings; taxes and interest expenses can also affect EPS but don’t tell us as much about a company’s fundamentals.
Like with revenue, we analyze EPS over a more recent period because it can provide insight into an emerging theme or development for the business.
For JELD-WEN, its two-year annual EPS declines of 49.7% show it’s continued to underperform. These results were bad no matter how you slice the data.
In Q1, JELD-WEN reported EPS at negative $0.17, down from $0.21 in the same quarter last year. Despite falling year on year, this print easily cleared analysts’ estimates. Over the next 12 months, Wall Street expects JELD-WEN’s full-year EPS of $0.40 to grow 51.9%.
Key Takeaways from JELD-WEN’s Q1 Results
We were impressed by how significantly JELD-WEN blew past analysts’ organic revenue expectations this quarter. We were also glad its EPS and EBITDA outperformed Wall Street’s estimates. Zooming out, we think this quarter featured some important positives, but shares traded down 6.3% to $5.25 immediately after reporting.
Is JELD-WEN an attractive investment opportunity at the current price? We think that the latest quarter is only one piece of the longer-term business quality puzzle. Quality, when combined with valuation, can help determine if the stock is a buy. We cover that in our actionable full research report which you can read here, it’s free.


