
Car rental services provider Avis (NASDAQ: CAR) fell short of the market’s revenue expectations in Q1 CY2025, with sales falling 4.7% year on year to $2.43 billion. Its GAAP loss of $14.35 per share was significantly below analysts’ consensus estimates.
Is now the time to buy Avis Budget Group? Find out by accessing our full research report, it’s free.
Avis Budget Group (CAR) Q1 CY2025 Highlights:
- Revenue: $2.43 billion vs analyst estimates of $2.50 billion (4.7% year-on-year decline, 2.9% miss)
- EPS (GAAP): -$14.35 vs analyst estimates of -$5.61 (significant miss)
- Adjusted EBITDA: -$93 million vs analyst estimates of -$112.9 million (-3.8% margin, 17.6% beat)
- Operating Margin: 31.6%, up from -2.1% in the same quarter last year
- Free Cash Flow was $619 million, up from -$471.4 million in the same quarter last year
- Available rental days - Car rental: 56.82 million, down 3.91 million year on year
- Market Capitalization: $3.42 billion
“We made substantial progress on our fleet rotation strategy during the first quarter, disposing of a record number of vehicles,” said Joe Ferraro, Avis Budget Group Chief Executive Officer.
Company Overview
The parent company of brands such as Zipcar and Budget Truck Rental, Avis (NASDAQ: CAR) is a provider of car rental and mobility solutions.
Sales Growth
A company’s long-term sales performance can indicate its overall quality. Any business can put up a good quarter or two, but the best consistently grow over the long haul. Unfortunately, Avis Budget Group’s 5.3% annualized revenue growth over the last five years was tepid. This fell short of our benchmark for the industrials sector and is a poor baseline for our analysis.
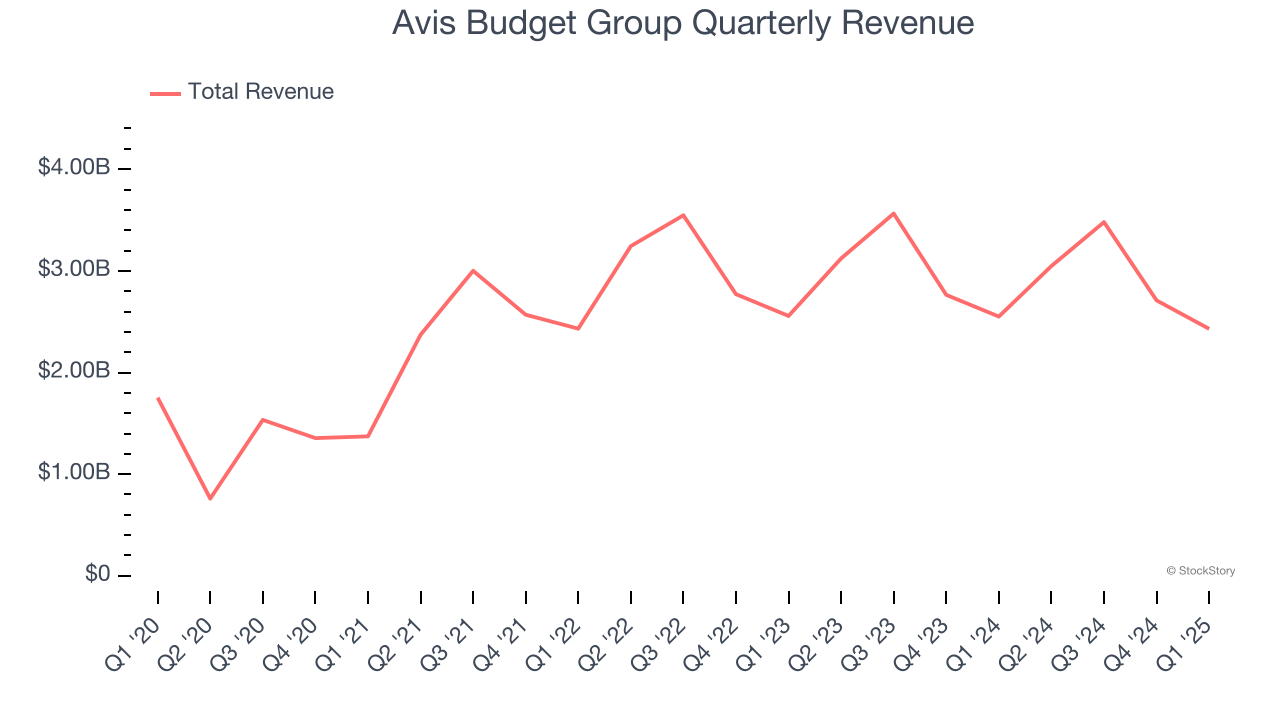
Long-term growth is the most important, but within industrials, a half-decade historical view may miss new industry trends or demand cycles. Avis Budget Group’s performance shows it grew in the past but relinquished its gains over the last two years, as its revenue fell by 1.9% annually. Avis Budget Group isn’t alone in its struggles as the Ground Transportation industry experienced a cyclical downturn, with many similar businesses observing lower sales at this time. 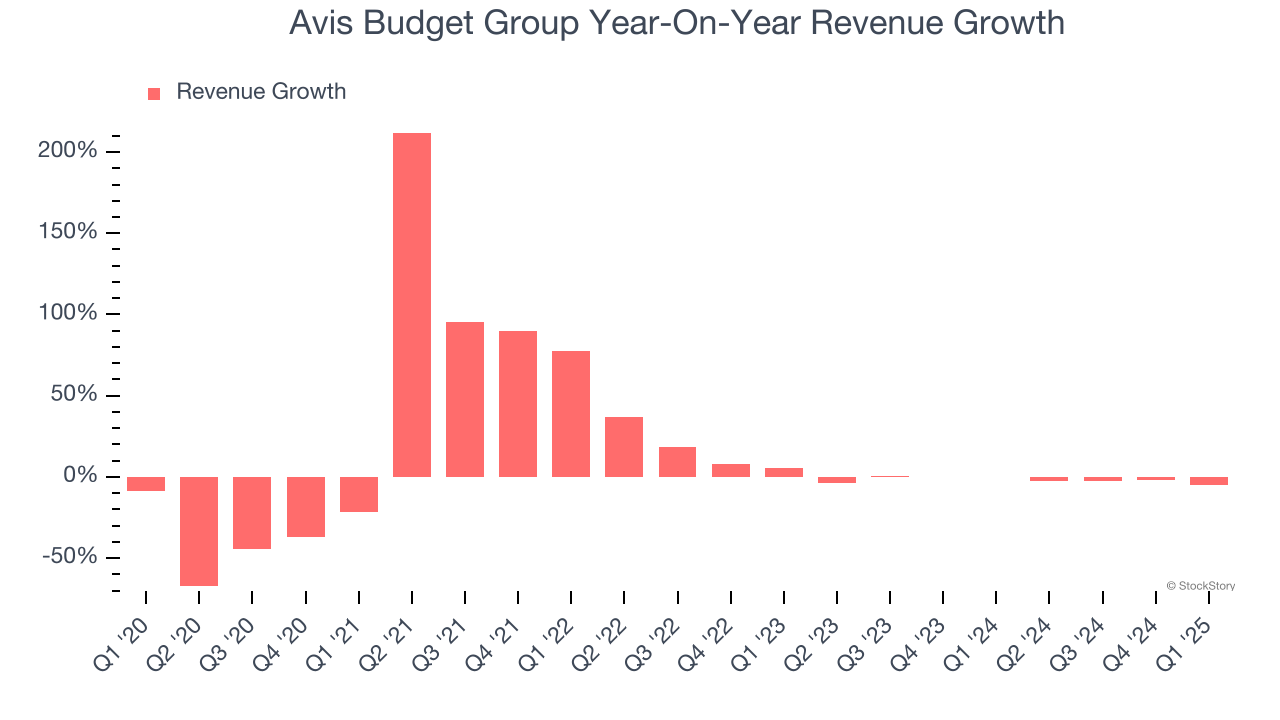
Avis Budget Group also discloses its number of available rental days - car rental, which reached 56.82 million in the latest quarter. Over the last two years, Avis Budget Group’s available rental days - car rental averaged 2% year-on-year growth. Because this number is higher than its revenue growth during the same period, we can see the company’s monetization has fallen. 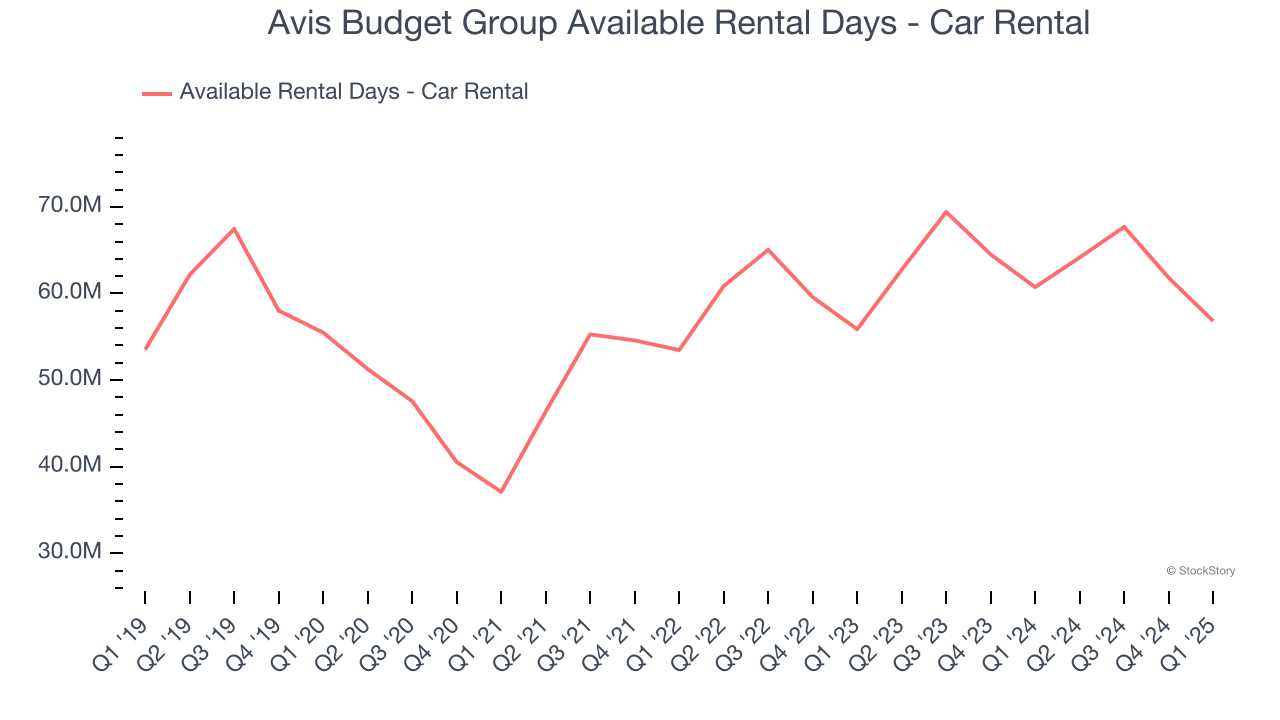
This quarter, Avis Budget Group missed Wall Street’s estimates and reported a rather uninspiring 4.7% year-on-year revenue decline, generating $2.43 billion of revenue.
Looking ahead, sell-side analysts expect revenue to grow 2.4% over the next 12 months. Although this projection suggests its newer products and services will spur better top-line performance, it is still below average for the sector.
Software is eating the world and there is virtually no industry left that has been untouched by it. That drives increasing demand for tools helping software developers do their jobs, whether it be monitoring critical cloud infrastructure, integrating audio and video functionality, or ensuring smooth content streaming. Click here to access a free report on our 3 favorite stocks to play this generational megatrend.
Operating Margin
Avis Budget Group has been a well-oiled machine over the last five years. It demonstrated elite profitability for an industrials business, boasting an average operating margin of 17.4%. This result isn’t surprising as its high gross margin gives it a favorable starting point.
Analyzing the trend in its profitability, Avis Budget Group’s operating margin rose by 18.7 percentage points over the last five years, as its sales growth gave it operating leverage.
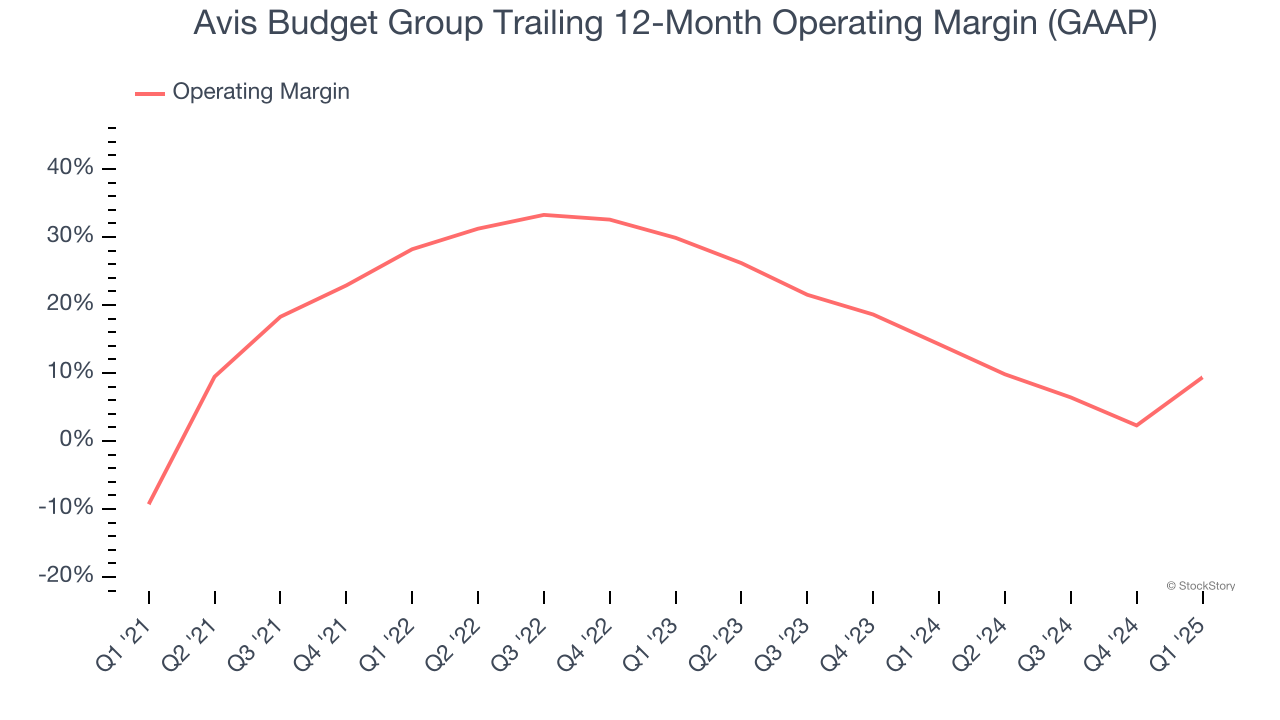
This quarter, Avis Budget Group generated an operating profit margin of 31.6%, up 33.8 percentage points year on year. The increase was solid, and because its operating margin rose more than its gross margin, we can infer it was more efficient with expenses such as marketing, R&D, and administrative overhead.
Earnings Per Share
We track the long-term change in earnings per share (EPS) for the same reason as long-term revenue growth. Compared to revenue, however, EPS highlights whether a company’s growth is profitable.
Sadly for Avis Budget Group, its EPS declined by 86.6% annually over the last five years while its revenue grew by 5.3%. We can see the difference stemmed from higher interest expenses or taxes as the company actually grew its operating margin and repurchased its shares during this time.
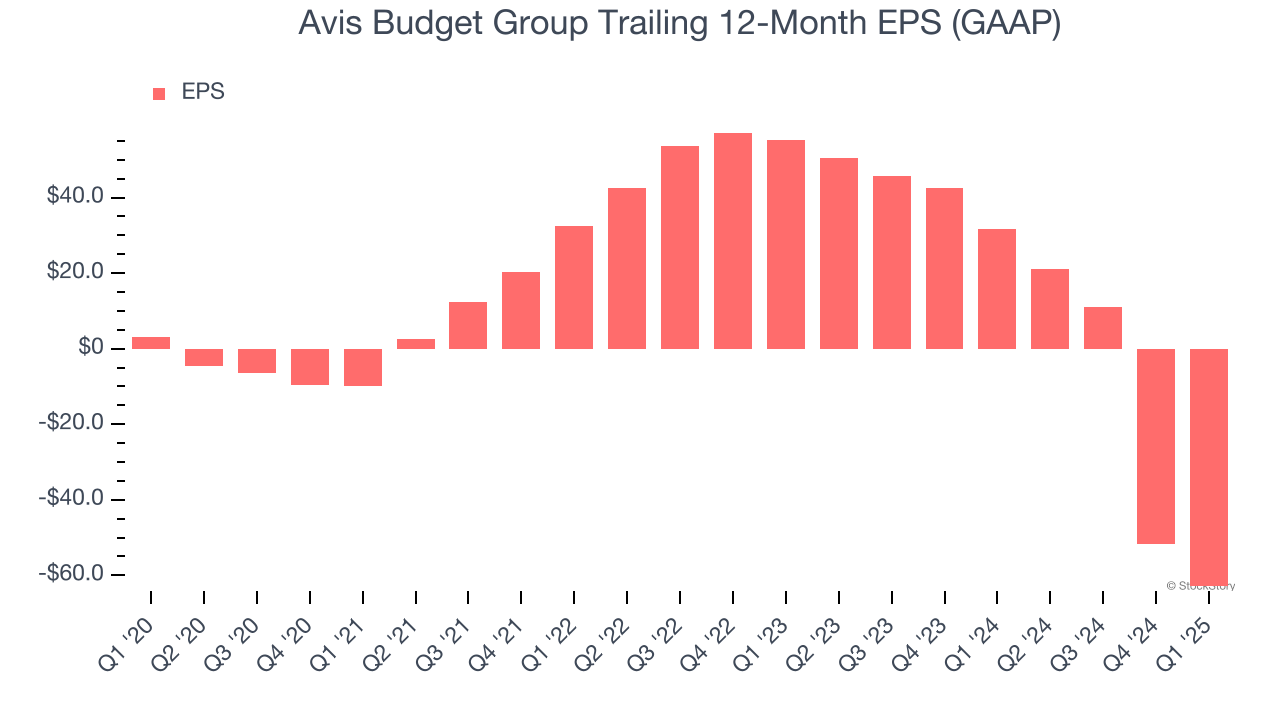
Like with revenue, we analyze EPS over a shorter period to see if we are missing a change in the business.
For Avis Budget Group, its two-year annual EPS declines of 77.2% show it’s still underperforming. These results were bad no matter how you slice the data.
In Q1, Avis Budget Group reported EPS at negative $14.35, down from negative $3.20 in the same quarter last year. This print missed analysts’ estimates. We also like to analyze expected EPS growth based on Wall Street analysts’ consensus projections, but there is insufficient data.
Key Takeaways from Avis Budget Group’s Q1 Results
We were impressed by how significantly Avis Budget Group blew past analysts’ EBITDA expectations this quarter. On the other hand, its revenue missed significantly and its EPS fell short of Wall Street’s estimates. Overall, this quarter could have been better. Still, the stock traded up 2.6% to $103 immediately following the results.
Should you buy the stock or not? If you’re making that decision, you should consider the bigger picture of valuation, business qualities, as well as the latest earnings. We cover that in our actionable full research report which you can read here, it’s free.


