
Pop culture collectibles manufacturer Funko (NASDAQ: FNKO) met Wall Street’s revenue expectations in Q1 CY2025, but sales fell by 11.6% year on year to $190.7 million. Its non-GAAP loss of $0.33 per share was 24.1% above analysts’ consensus estimates.
Is now the time to buy Funko? Find out by accessing our full research report, it’s free.
Funko (FNKO) Q1 CY2025 Highlights:
- Revenue: $190.7 million vs analyst estimates of $189.8 million (11.6% year-on-year decline, in line)
- Adjusted EPS: -$0.33 vs analyst estimates of -$0.44 (24.1% beat)
- Adjusted EBITDA: -$4.66 million vs analyst estimates of -$11.3 million (-2.4% margin, 58.7% beat)
- Operating Margin: -12.2%, down from -6.9% in the same quarter last year
- Free Cash Flow was -$28.81 million, down from $10.43 million in the same quarter last year
- Market Capitalization: $215.5 million
Company Overview
Boasting partnerships with media franchises like Marvel and One Piece, Funko (NASDAQ: FNKO) is a company specializing in creating and distributing licensed pop culture collectibles.
Sales Growth
Examining a company’s long-term performance can provide clues about its quality. Any business can experience short-term success, but top-performing ones enjoy sustained growth for years. Unfortunately, Funko’s 6% annualized revenue growth over the last five years was sluggish. This fell short of our benchmark for the consumer discretionary sector and is a tough starting point for our analysis.
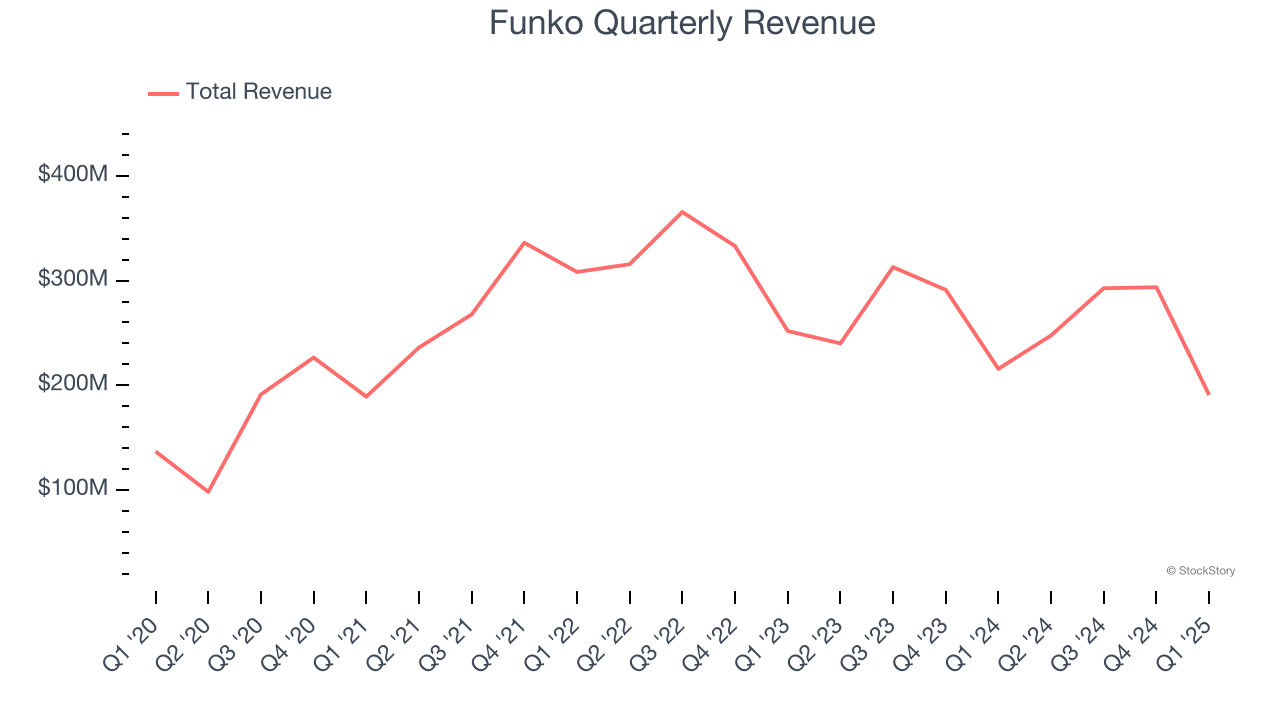
Long-term growth is the most important, but within consumer discretionary, product cycles are short and revenue can be hit-driven due to rapidly changing trends and consumer preferences. Funko’s performance shows it grew in the past but relinquished its gains over the last two years, as its revenue fell by 10% annually. 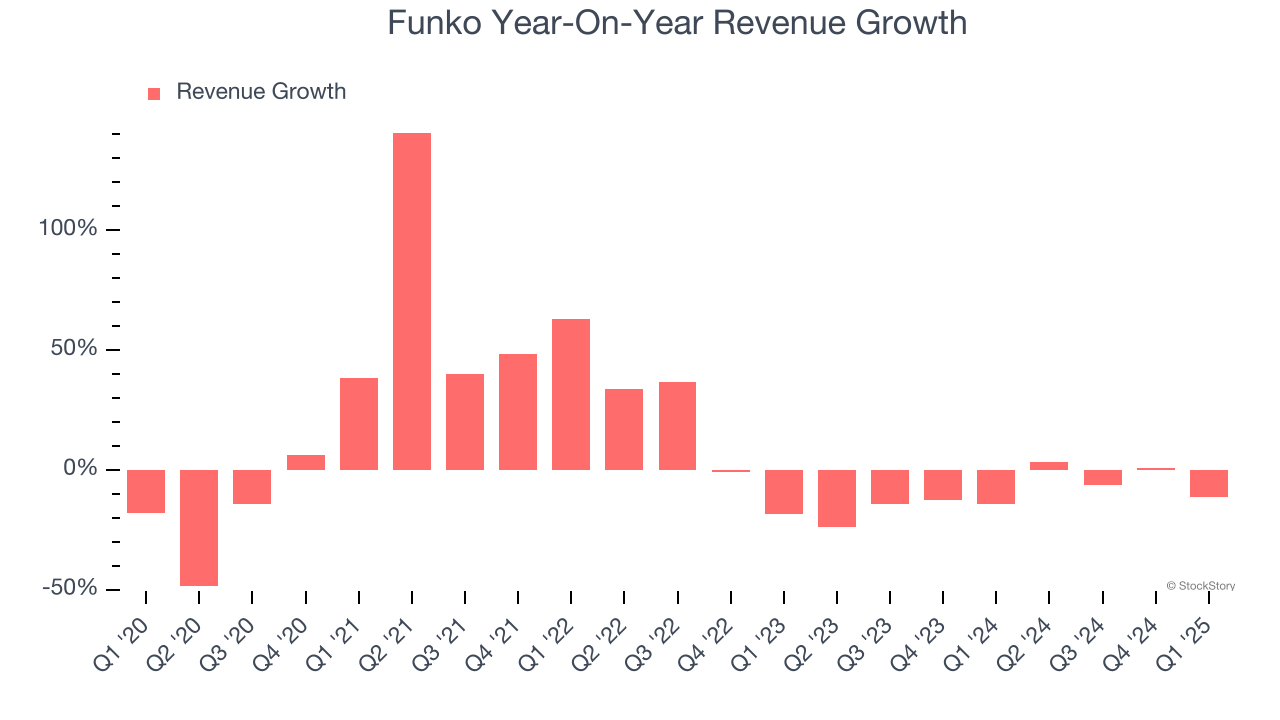
This quarter, Funko reported a rather uninspiring 11.6% year-on-year revenue decline to $190.7 million of revenue, in line with Wall Street’s estimates.
Looking ahead, sell-side analysts expect revenue to grow 6.2% over the next 12 months. While this projection suggests its newer products and services will fuel better top-line performance, it is still below average for the sector.
Unless you’ve been living under a rock, it should be obvious by now that generative AI is going to have a huge impact on how large corporations do business. While Nvidia and AMD are trading close to all-time highs, we prefer a lesser-known (but still profitable) stock benefiting from the rise of AI. Click here to access our free report one of our favorites growth stories.
Operating Margin
Operating margin is an important measure of profitability as it shows the portion of revenue left after accounting for all core expenses – everything from the cost of goods sold to advertising and wages. It’s also useful for comparing profitability across companies with different levels of debt and tax rates because it excludes interest and taxes.
Funko’s operating margin has risen over the last 12 months, but it still averaged negative 2.4% over the last two years. This is due to its large expense base and inefficient cost structure.
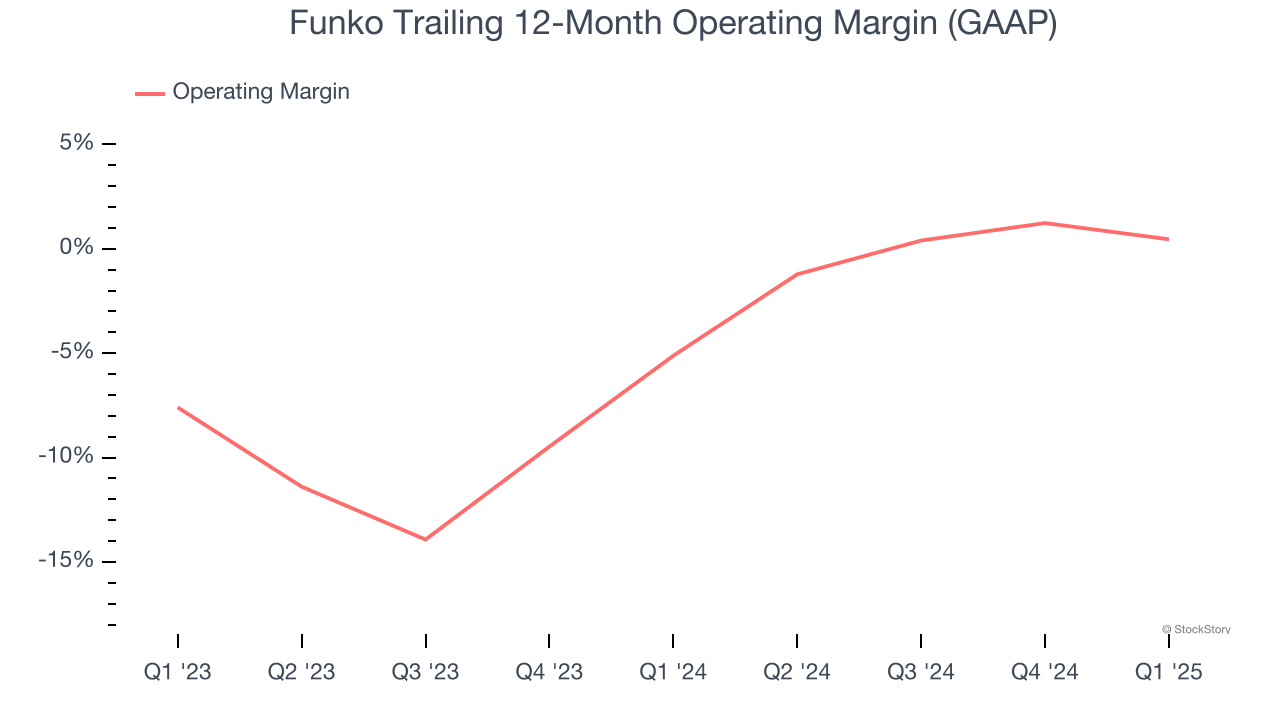
This quarter, Funko generated a negative 12.2% operating margin. The company's consistent lack of profits raise a flag.
Earnings Per Share
We track the long-term change in earnings per share (EPS) for the same reason as long-term revenue growth. Compared to revenue, however, EPS highlights whether a company’s growth is profitable.
Sadly for Funko, its EPS declined by 14.9% annually over the last five years while its revenue grew by 6%. This tells us the company became less profitable on a per-share basis as it expanded.
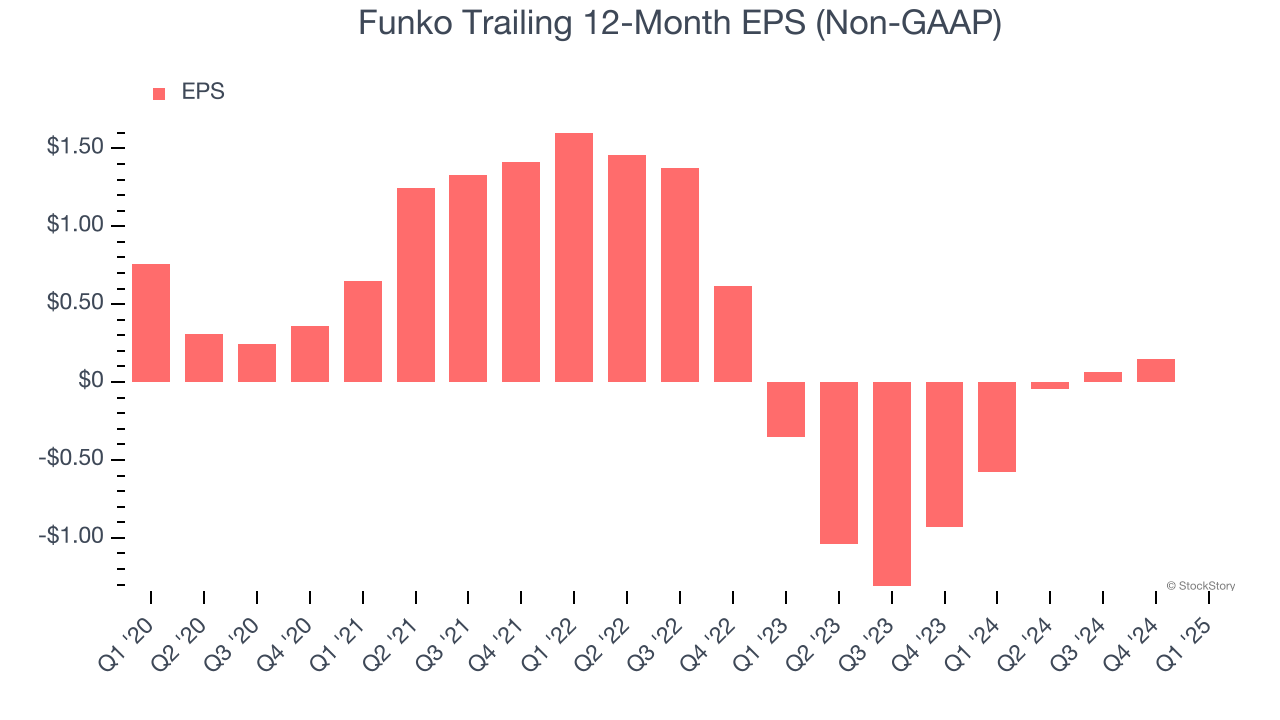
In Q1, Funko reported EPS at negative $0.33, down from negative $0.18 in the same quarter last year. Despite falling year on year, this print easily cleared analysts’ estimates. Over the next 12 months, Wall Street is optimistic. Analysts forecast Funko’s full-year EPS of negative $0 will reach break even.
Key Takeaways from Funko’s Q1 Results
We were impressed by how significantly Funko blew past analysts’ EBITDA expectations this quarter. We were also glad its EPS outperformed Wall Street’s estimates. Zooming out, we think this was a good print with some key areas of upside. The stock traded up 5% to $4.40 immediately after reporting.
Sure, Funko had a solid quarter, but if we look at the bigger picture, is this stock a buy? The latest quarter does matter, but not nearly as much as longer-term fundamentals and valuation, when deciding if the stock is a buy. We cover that in our actionable full research report which you can read here, it’s free.


