
Over the past six months, Brink’s stock price fell to $84.07. Shareholders have lost 12.4% of their capital, disappointing when considering the S&P 500 was flat. This may have investors wondering how to approach the situation.
Is now the time to buy Brink's, or should you be careful about including it in your portfolio? Get the full breakdown from our expert analysts, it’s free.
Why Is Brink's Not Exciting?
Even with the cheaper entry price, we don't have much confidence in Brink's. Here are three reasons why we avoid BCO and a stock we'd rather own.
1. Lackluster Revenue Growth
We at StockStory place the most emphasis on long-term growth, but within business services, a stretched historical view may miss recent innovations or disruptive industry trends. Brink’s recent performance shows its demand has slowed as its annualized revenue growth of 4% over the last two years was below its five-year trend. 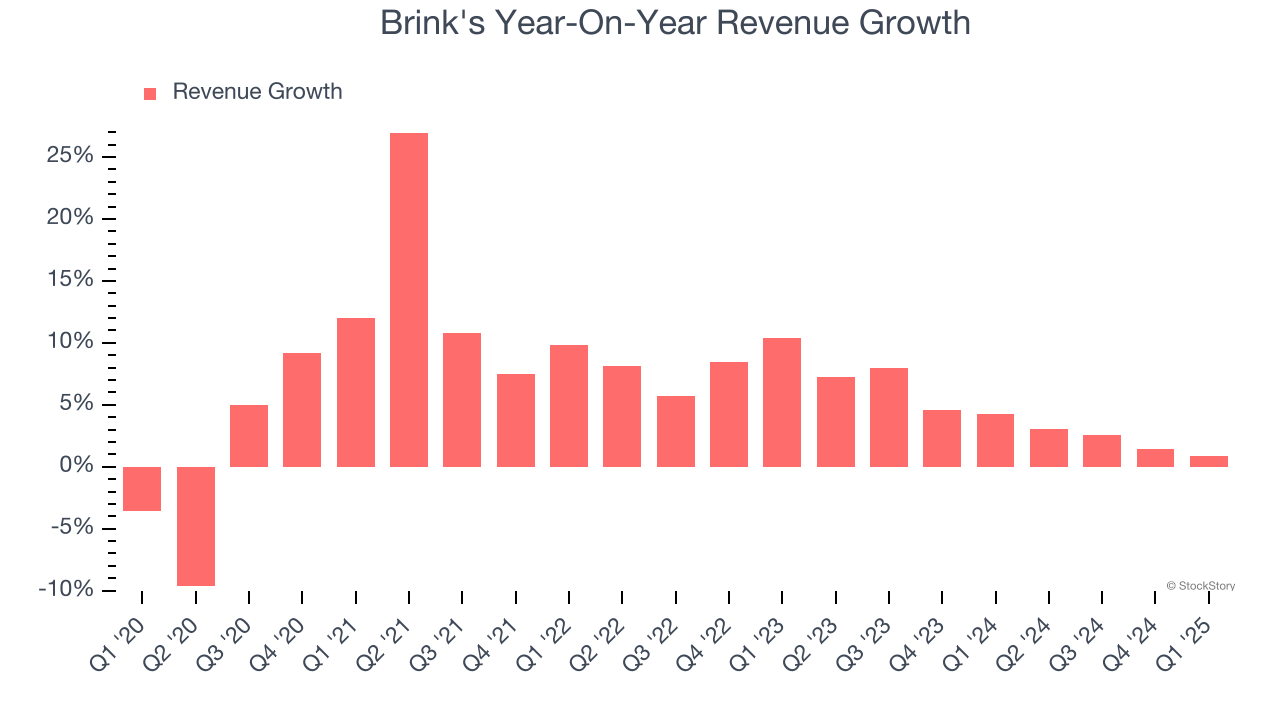
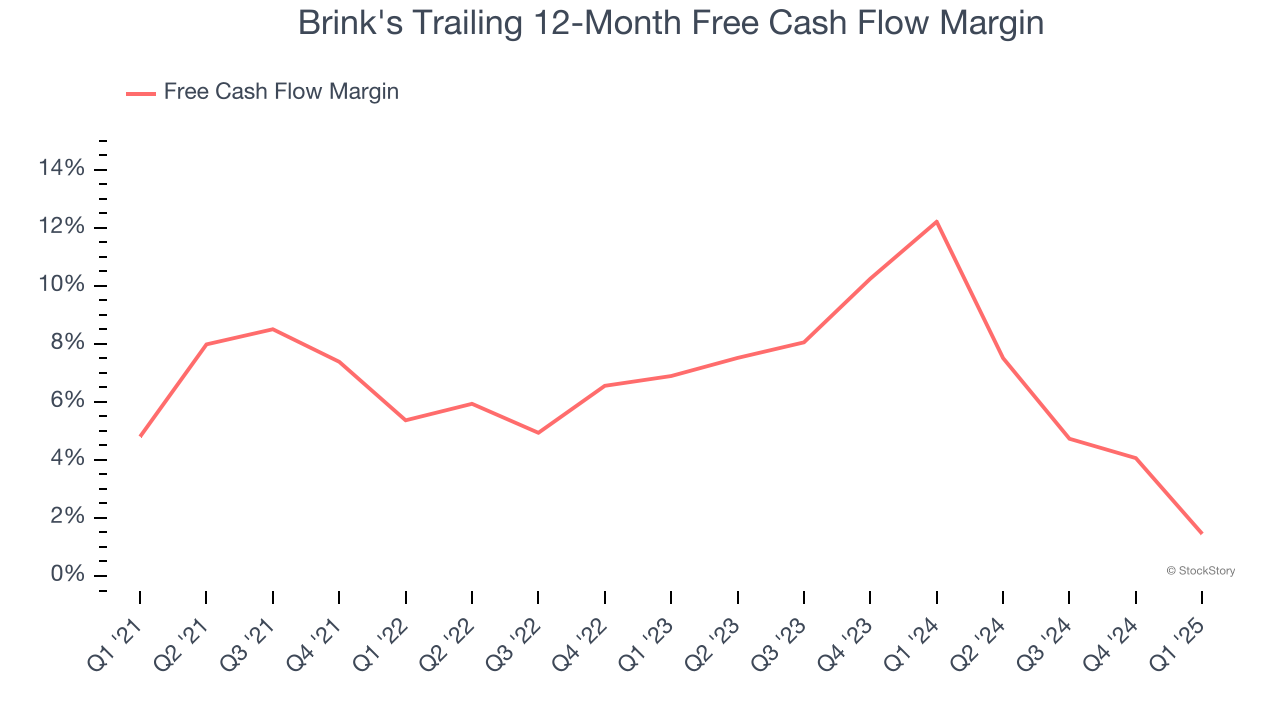
2. Free Cash Flow Margin Dropping
Free cash flow isn't a prominently featured metric in company financials and earnings releases, but we think it's telling because it accounts for all operating and capital expenses, making it tough to manipulate. Cash is king.
As you can see below, Brink’s margin dropped by 3.4 percentage points over the last five years. If its declines continue, it could signal increasing investment needs and capital intensity. Brink’s free cash flow margin for the trailing 12 months was 1.4%.
3. Previous Growth Initiatives Haven’t Impressed
Growth gives us insight into a company’s long-term potential, but how capital-efficient was that growth? Enter ROIC, a metric showing how much operating profit a company generates relative to the money it has raised (debt and equity).
Brink's historically did a mediocre job investing in profitable growth initiatives. Its five-year average ROIC was 12.7%, somewhat low compared to the best business services companies that consistently pump out 25%+.
Final Judgment
Brink's isn’t a terrible business, but it isn’t one of our picks. Following the recent decline, the stock trades at 11.3× forward P/E (or $84.07 per share). This valuation is reasonable, but the company’s shakier fundamentals present too much downside risk. We're fairly confident there are better investments elsewhere. Let us point you toward a fast-growing restaurant franchise with an A+ ranch dressing sauce.
Stocks We Would Buy Instead of Brink's
Donald Trump’s victory in the 2024 U.S. Presidential Election sent major indices to all-time highs, but stocks have retraced as investors debate the health of the economy and the potential impact of tariffs.
While this leaves much uncertainty around 2025, a few companies are poised for long-term gains regardless of the political or macroeconomic climate, like our Top 9 Market-Beating Stocks. This is a curated list of our High Quality stocks that have generated a market-beating return of 183% over the last five years (as of March 31st 2025).
Stocks that made our list in 2020 include now familiar names such as Nvidia (+1,545% between March 2020 and March 2025) as well as under-the-radar businesses like the once-small-cap company Exlservice (+354% five-year return). Find your next big winner with StockStory today.