
Potato products company Lamb Weston (NYSE: LW) reported Q2 CY2025 results exceeding the market’s revenue expectations, with sales up 4% year on year to $1.68 billion. The company’s full-year revenue guidance of $6.45 billion at the midpoint came in 0.7% above analysts’ estimates. Its non-GAAP profit of $0.87 per share was 38.2% above analysts’ consensus estimates.
Is now the time to buy Lamb Weston? Find out by accessing our full research report, it’s free.
Lamb Weston (LW) Q2 CY2025 Highlights:
- Revenue: $1.68 billion vs analyst estimates of $1.59 billion (4% year-on-year growth, 5.7% beat)
- Adjusted EPS: $0.87 vs analyst estimates of $0.63 (38.2% beat)
- Adjusted EBITDA: $284.9 million vs analyst estimates of $253.3 million (17% margin, 12.5% beat)
- EBITDA guidance for the upcoming financial year 2026 is $1.1 billion at the midpoint, below analyst estimates of $1.23 billion
- Operating Margin: 11.1%, down from 13.2% in the same quarter last year
- Free Cash Flow Margin: 17.6%, up from 9.3% in the same quarter last year
- Organic Revenue rose 4% year on year (-5% in the same quarter last year)
- Sales Volumes rose 8% year on year (-8% in the same quarter last year)
- Market Capitalization: $6.94 billion
“Lamb Weston returned to growth in the second half of the year with momentum in customer wins and retention, delivering financial results above our updated expectations,” said Mike Smith, Lamb Weston president and CEO.
Company Overview
Best known for its Grown in Idaho brand, Lamb Weston (NYSE: LW) produces and distributes potato products such as frozen french fries and mashed potatoes.
Revenue Growth
A company’s long-term performance is an indicator of its overall quality. Any business can experience short-term success, but top-performing ones enjoy sustained growth for years.
With $6.45 billion in revenue over the past 12 months, Lamb Weston is one of the larger consumer staples companies and benefits from a well-known brand that influences purchasing decisions.
As you can see below, Lamb Weston’s sales grew at an impressive 16.3% compounded annual growth rate over the last three years as consumers bought more of its products.
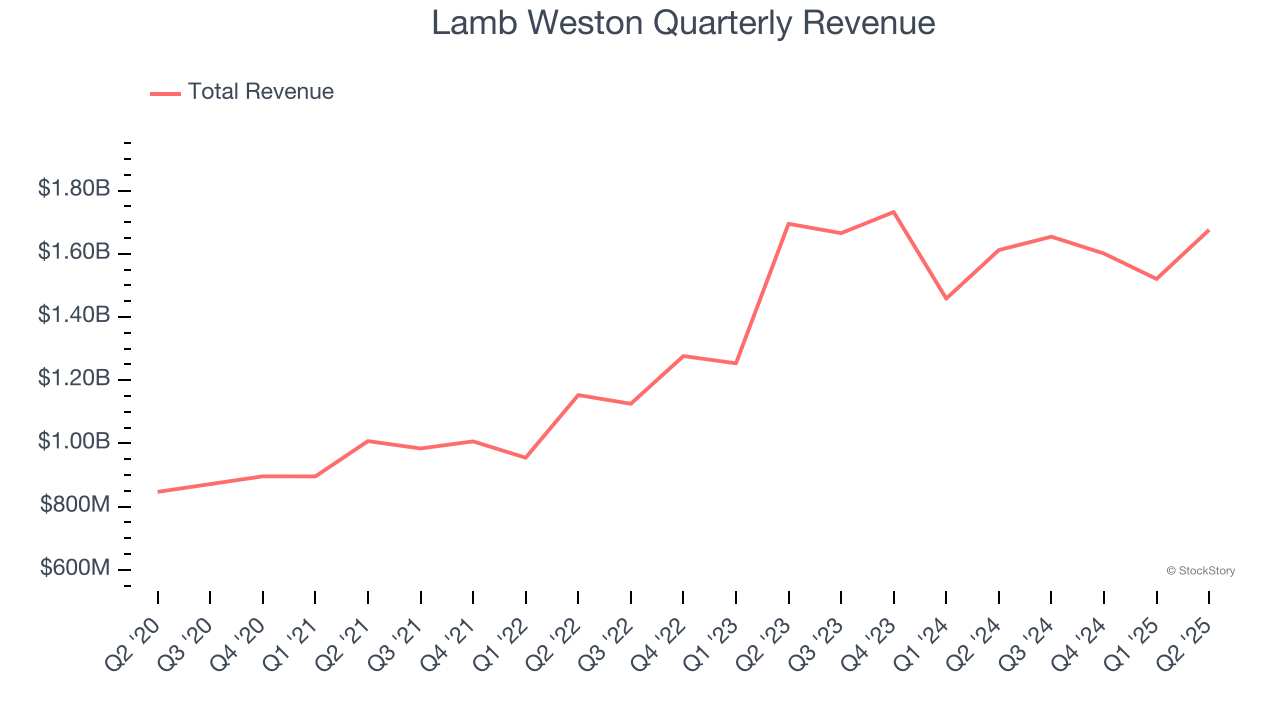
This quarter, Lamb Weston reported modest year-on-year revenue growth of 4% but beat Wall Street’s estimates by 5.7%.
Looking ahead, sell-side analysts expect revenue to decline by 1.2% over the next 12 months, a deceleration versus the last three years. This projection is underwhelming and suggests its products will face some demand challenges.
Unless you’ve been living under a rock, it should be obvious by now that generative AI is going to have a huge impact on how large corporations do business. While Nvidia and AMD are trading close to all-time highs, we prefer a lesser-known (but still profitable) stock benefiting from the rise of AI. Click here to access our free report one of our favorites growth stories.
Volume Growth
Revenue growth can be broken down into changes in price and volume (the number of units sold). While both are important, volume is the lifeblood of a successful staples business as there’s a ceiling to what consumers will pay for everyday goods; they can always trade down to non-branded products if the branded versions are too expensive.
To analyze whether Lamb Weston generated its growth from changes in price or volume, we can compare its volume growth to its organic revenue growth, which excludes non-fundamental impacts on company financials like mergers and currency fluctuations.
Over the last two years, Lamb Weston’s average quarterly volume growth was a robust 7.6%. In the context of its 11.8% average organic revenue growth, we can see that most of the company’s gains have come from more customers purchasing its products.
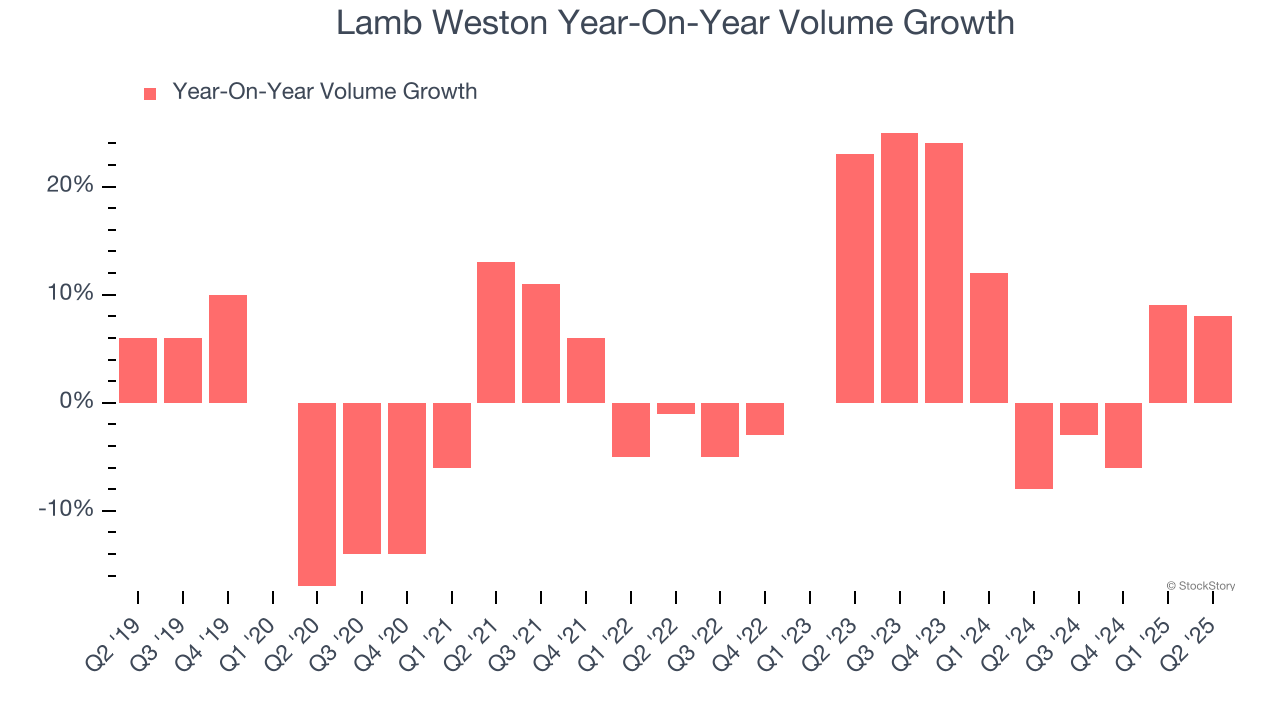
In Lamb Weston’s Q2 2025, sales volumes jumped 8% year on year. This result was in line with its historical levels.
Key Takeaways from Lamb Weston’s Q2 Results
We were impressed by how significantly Lamb Weston blew past analysts’ EBITDA expectations this quarter. We were also excited its organic revenue outperformed Wall Street’s estimates by a wide margin. On the other hand, its full-year EBITDA guidance missed and its gross margin fell short of Wall Street’s estimates. Overall, we think this was still a solid quarter with some key areas of upside. The stock traded up 5.3% to $51.75 immediately following the results.
Lamb Weston may have had a good quarter, but does that mean you should invest right now? What happened in the latest quarter matters, but not as much as longer-term business quality and valuation, when deciding whether to invest in this stock. We cover that in our actionable full research report which you can read here, it’s free.


