
Healthcare distributor and services company Cardinal Health (NYSE: CAH) missed Wall Street’s revenue expectations in Q2 CY2025, with sales flat year on year at $60.16 billion. Its non-GAAP profit of $2.08 per share was 2.4% above analysts’ consensus estimates.
Is now the time to buy Cardinal Health? Find out by accessing our full research report, it’s free.
Cardinal Health (CAH) Q2 CY2025 Highlights:
- Revenue: $60.16 billion vs analyst estimates of $60.75 billion (flat year on year, 1% miss)
- Adjusted EPS: $2.08 vs analyst estimates of $2.03 (2.4% beat)
- Adjusted EBITDA: $743 million vs analyst estimates of $832.1 million (1.2% margin, 10.7% miss)
- Adjusted EPS guidance for the upcoming financial year 2026 is $9.40 at the midpoint, beating analyst estimates by 1.6%
- Operating Margin: 0.7%, in line with the same quarter last year
- Free Cash Flow Margin: 2.2%, down from 3.2% in the same quarter last year
- Market Capitalization: $37.63 billion
"Fiscal 2025 was a transformative year for Cardinal Health, and we closed the year with momentum, delivering strong fourth quarter results," said Jason Hollar, CEO of Cardinal Health.
Company Overview
Operating as a critical link in the healthcare supply chain since 1979, Cardinal Health (NYSE: CAH) distributes pharmaceuticals and manufactures medical products for hospitals, pharmacies, and healthcare providers across the global healthcare supply chain.
Revenue Growth
A company’s long-term performance is an indicator of its overall quality. Even a bad business can shine for one or two quarters, but a top-tier one grows for years. Thankfully, Cardinal Health’s 7.8% annualized revenue growth over the last five years was decent. Its growth was slightly above the average healthcare company and shows its offerings resonate with customers.
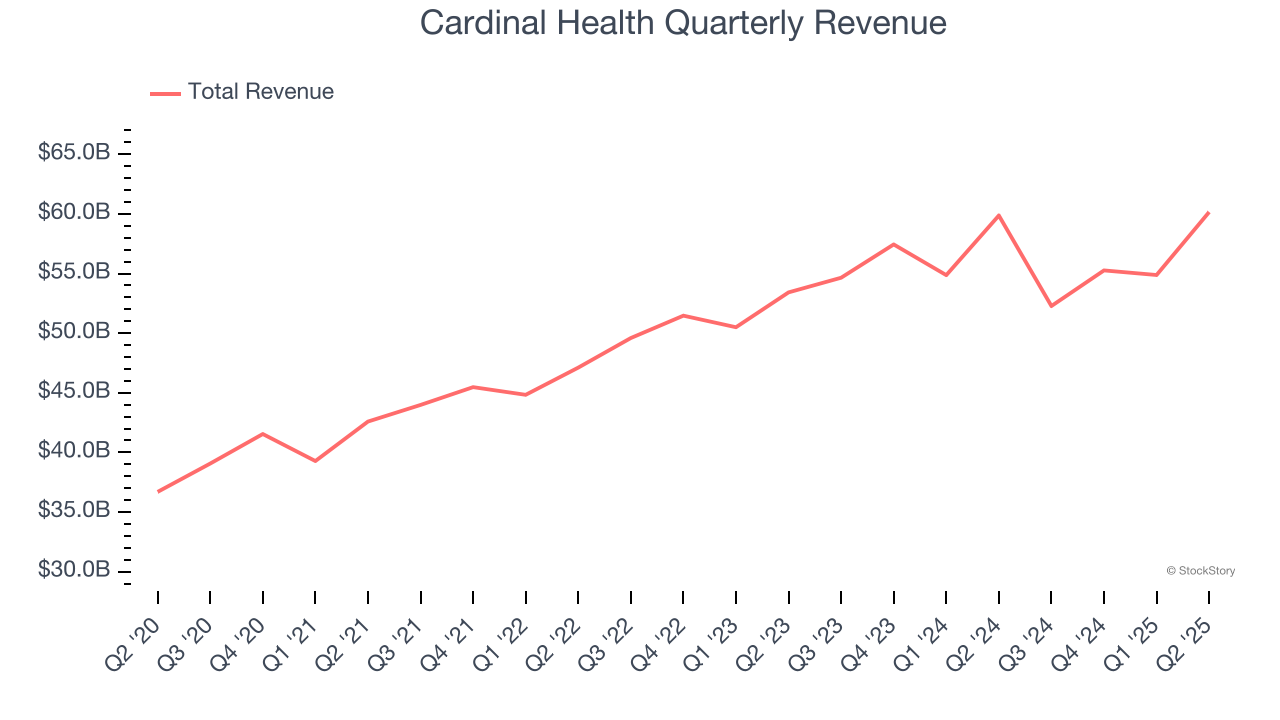
Long-term growth is the most important, but within healthcare, a half-decade historical view may miss new innovations or demand cycles. Cardinal Health’s recent performance shows its demand has slowed as its annualized revenue growth of 4.2% over the last two years was below its five-year trend. 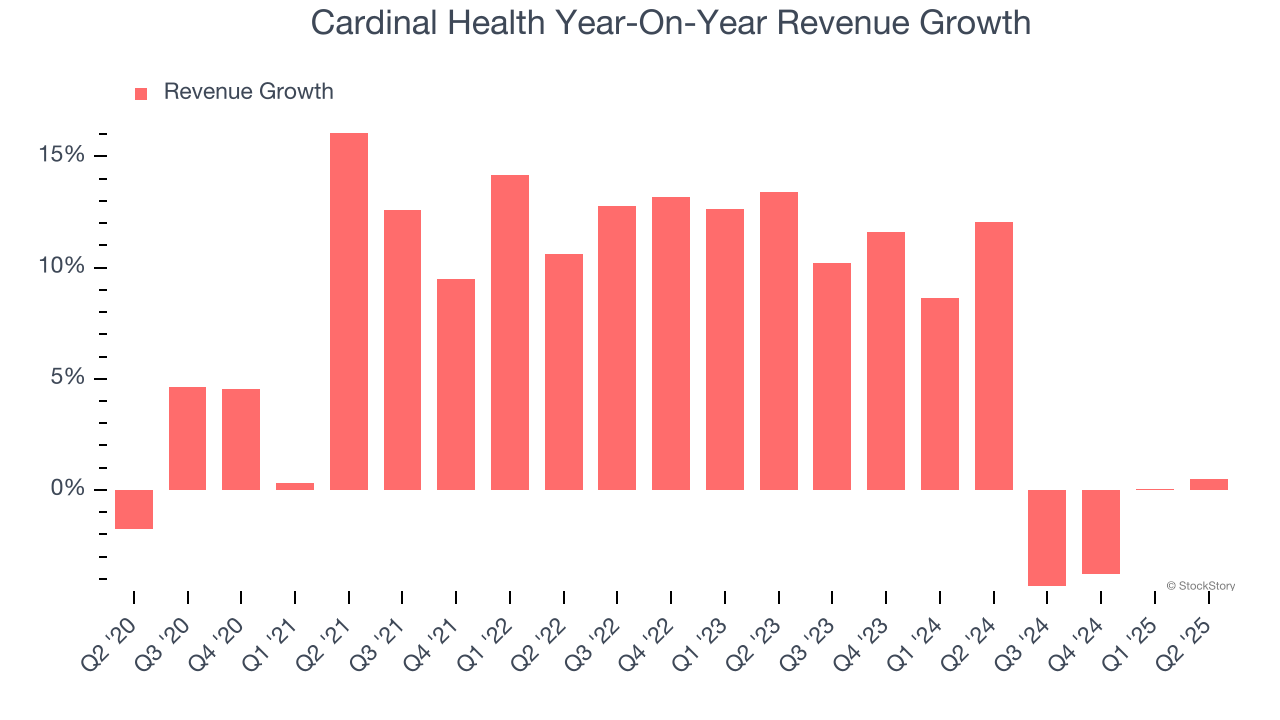
This quarter, Cardinal Health’s $60.16 billion of revenue was flat year on year, falling short of Wall Street’s estimates.
Looking ahead, sell-side analysts expect revenue to grow 11.8% over the next 12 months, an improvement versus the last two years. This projection is particularly noteworthy for a company of its scale and indicates its newer products and services will spur better top-line performance.
Here at StockStory, we certainly understand the potential of thematic investing. Diverse winners from Microsoft (MSFT) to Alphabet (GOOG), Coca-Cola (KO) to Monster Beverage (MNST) could all have been identified as promising growth stories with a megatrend driving the growth. So, in that spirit, we’ve identified a relatively under-the-radar profitable growth stock benefiting from the rise of AI, available to you FREE via this link.
Operating Margin
Cardinal Health’s operating margin might fluctuated slightly over the last 12 months but has remained more or less the same. The company broke even over the last five years, lousy for a healthcare business. Its large expense base and inefficient cost structure were the main culprits behind this performance.
Analyzing the trend in its profitability, Cardinal Health’s operating margin might fluctuated slightly but has generally stayed the same over the last five years. This raises questions about the company’s expense base because its revenue growth should have given it leverage on its fixed costs, resulting in better economies of scale and profitability.
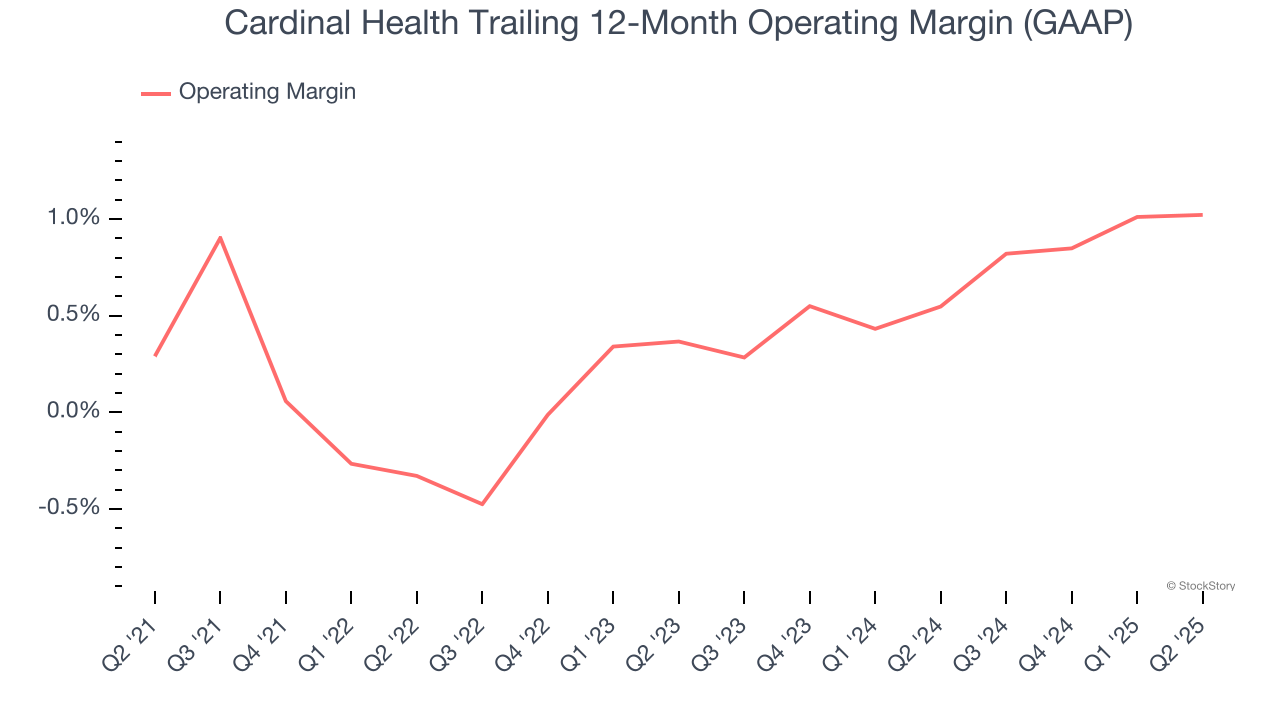
In Q2, Cardinal Health’s breakeven margin was in line with the same quarter last year. This indicates the company’s overall cost structure has been relatively stable.
Earnings Per Share
Revenue trends explain a company’s historical growth, but the long-term change in earnings per share (EPS) points to the profitability of that growth – for example, a company could inflate its sales through excessive spending on advertising and promotions.
Cardinal Health’s solid 8.6% annual EPS growth over the last five years aligns with its revenue performance. This tells us it maintained its per-share profitability as it expanded.
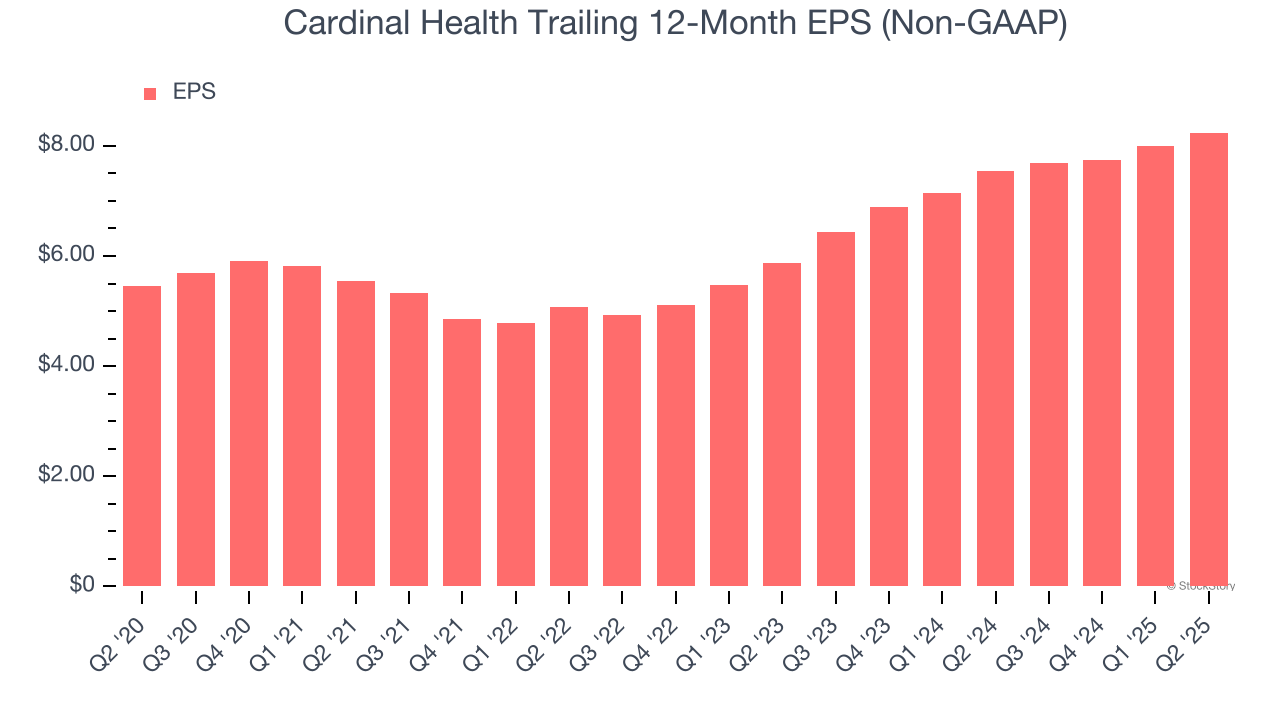
In Q2, Cardinal Health reported adjusted EPS at $2.08, up from $1.84 in the same quarter last year. This print beat analysts’ estimates by 2.4%. Over the next 12 months, Wall Street expects Cardinal Health’s full-year EPS of $8.24 to grow 12.3%.
Key Takeaways from Cardinal Health’s Q2 Results
It was encouraging to see Cardinal Health beat analysts’ full-year EPS guidance expectations this quarter. On the other hand, its revenue slightly missed. Overall, this was a weaker quarter. The stock traded down 3% to $153.11 immediately after reporting.
Big picture, is Cardinal Health a buy here and now? What happened in the latest quarter matters, but not as much as longer-term business quality and valuation, when deciding whether to invest in this stock. We cover that in our actionable full research report which you can read here, it’s free.


