
Slot machine and terminal operator Accel Entertainment (NYSE: ACEL) reported Q2 CY2025 results topping the market’s revenue expectations, with sales up 8.6% year on year to $335.9 million. Its GAAP profit of $0.08 per share was 51.1% below analysts’ consensus estimates.
Is now the time to buy Accel Entertainment? Find out by accessing our full research report, it’s free.
Accel Entertainment (ACEL) Q2 CY2025 Highlights:
- Revenue: $335.9 million vs analyst estimates of $332.5 million (8.6% year-on-year growth, 1% beat)
- EPS (GAAP): $0.08 vs analyst expectations of $0.16 (51.1% miss)
- Adjusted EBITDA: $53.18 million vs analyst estimates of $52.69 million (15.8% margin, 0.9% beat)
- Operating Margin: 8%, in line with the same quarter last year
- Video Gaming Terminals Sold: 27,388, up 1,631 year on year
- Market Capitalization: $1.04 billion
Company Overview
Established in Illinois, Accel Entertainment (NYSE: ACEL) is a provider of electronic gaming machines and interactive amusement terminals to bars and entertainment venues.
Revenue Growth
Reviewing a company’s long-term sales performance reveals insights into its quality. Any business can put up a good quarter or two, but the best consistently grow over the long haul. Luckily, Accel Entertainment’s sales grew at an incredible 31.1% compounded annual growth rate over the last five years. Its growth beat the average consumer discretionary company and shows its offerings resonate with customers.
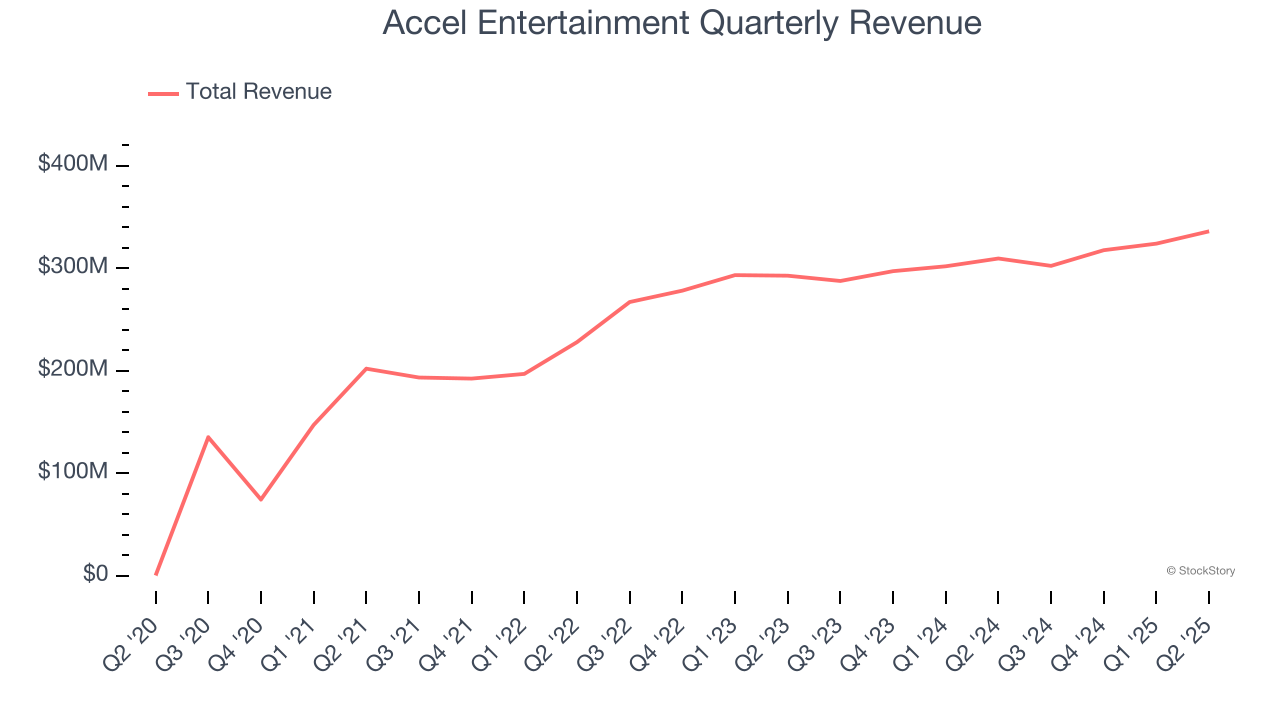
Long-term growth is the most important, but within consumer discretionary, product cycles are short and revenue can be hit-driven due to rapidly changing trends and consumer preferences. Accel Entertainment’s recent performance shows its demand has slowed significantly as its annualized revenue growth of 6.4% over the last two years was well below its five-year trend. 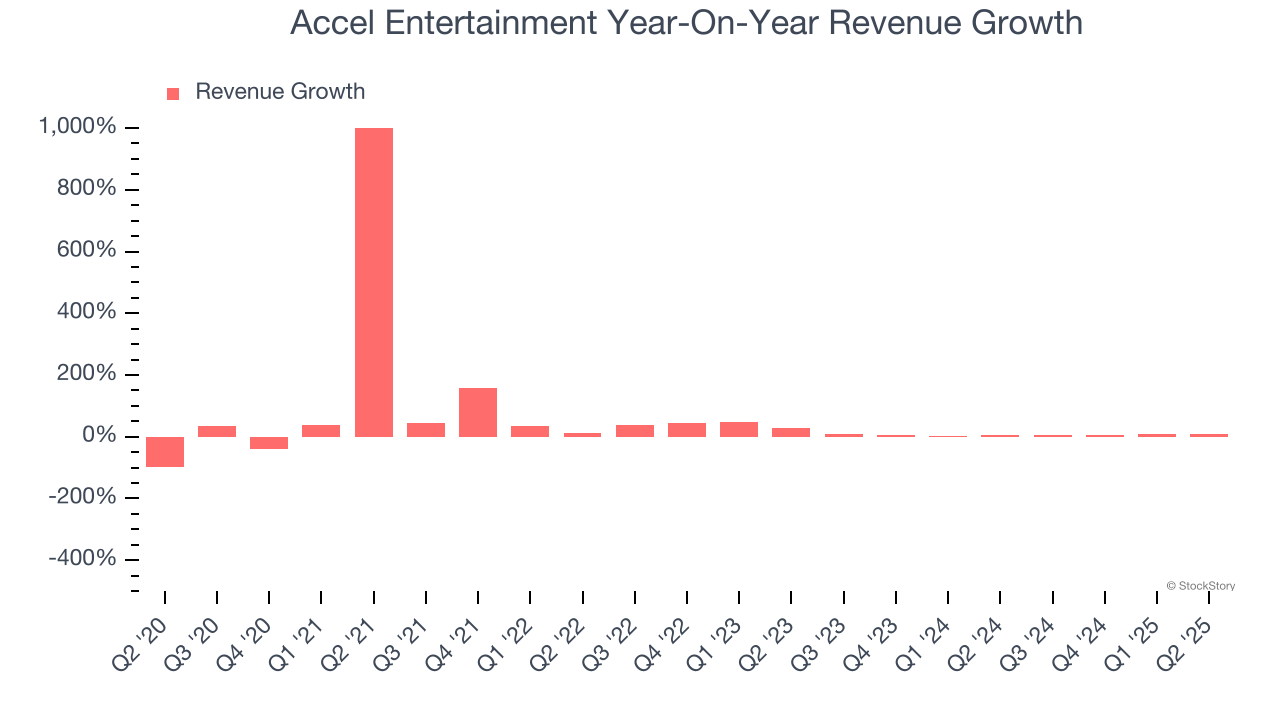
Accel Entertainment also discloses its number of video gaming terminals sold, which reached 27,388 in the latest quarter. Over the last two years, Accel Entertainment’s video gaming terminals sold averaged 6.4% year-on-year growth. Because this number aligns with its revenue growth during the same period, we can see the company’s monetization was fairly consistent. 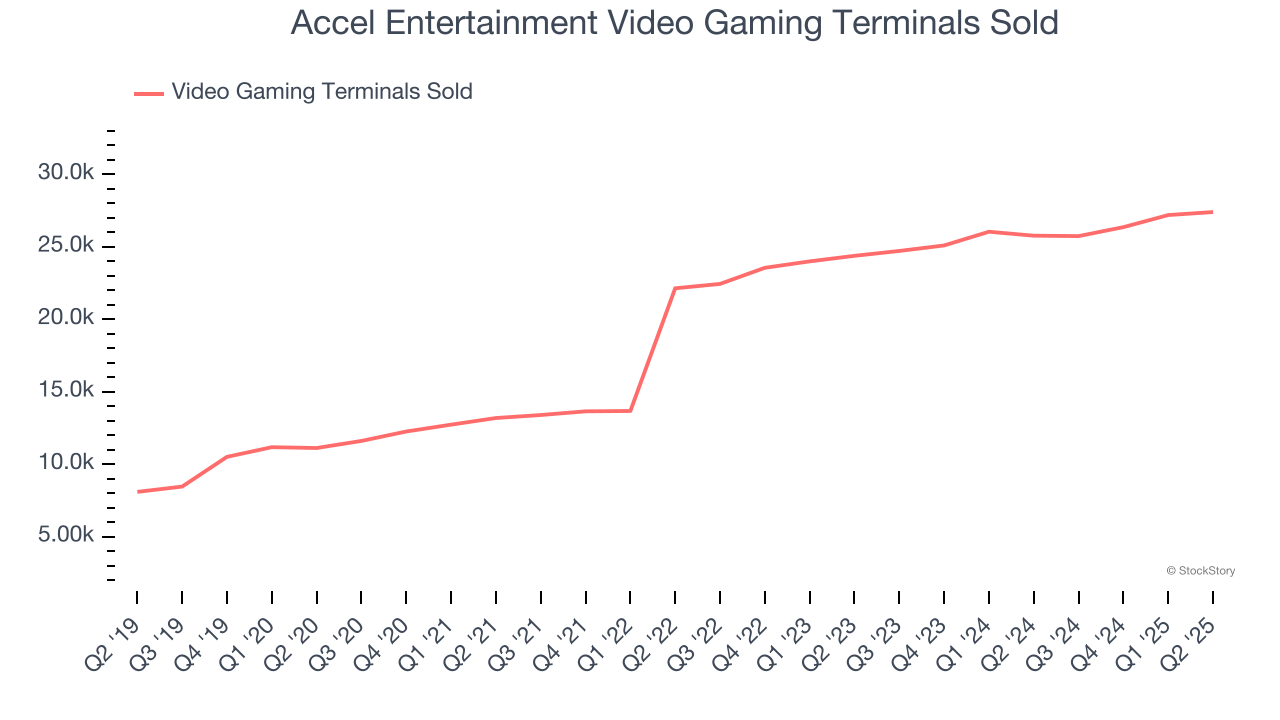
This quarter, Accel Entertainment reported year-on-year revenue growth of 8.6%, and its $335.9 million of revenue exceeded Wall Street’s estimates by 1%.
Looking ahead, sell-side analysts expect revenue to grow 5.4% over the next 12 months, similar to its two-year rate. This projection doesn't excite us and indicates its products and services will see some demand headwinds.
Software is eating the world and there is virtually no industry left that has been untouched by it. That drives increasing demand for tools helping software developers do their jobs, whether it be monitoring critical cloud infrastructure, integrating audio and video functionality, or ensuring smooth content streaming. Click here to access a free report on our 3 favorite stocks to play this generational megatrend.
Operating Margin
Accel Entertainment’s operating margin might fluctuated slightly over the last 12 months but has remained more or less the same, averaging 7.8% over the last two years. This profitability was paltry for a consumer discretionary business and caused by its suboptimal cost structure.
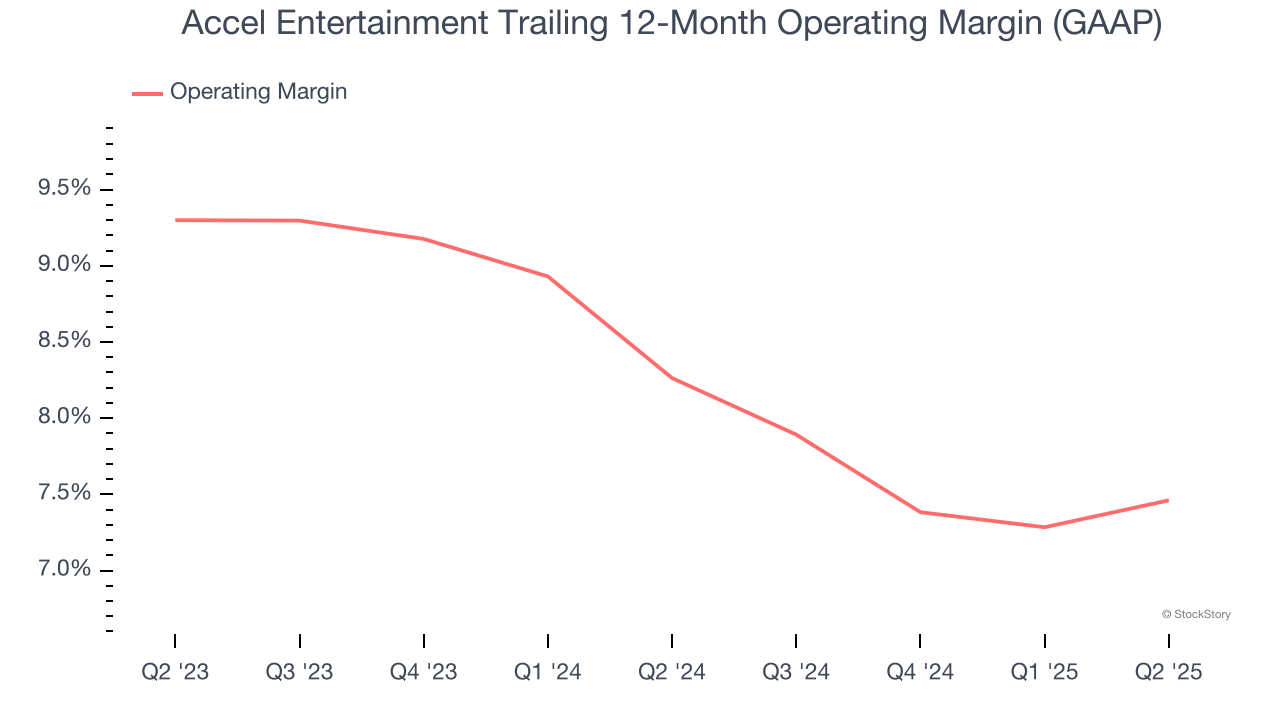
In Q2, Accel Entertainment generated an operating margin profit margin of 8%, in line with the same quarter last year. This indicates the company’s overall cost structure has been relatively stable.
Earnings Per Share
Revenue trends explain a company’s historical growth, but the long-term change in earnings per share (EPS) points to the profitability of that growth – for example, a company could inflate its sales through excessive spending on advertising and promotions.
Accel Entertainment’s full-year EPS flipped from negative to positive over the last five years. This is encouraging and shows it’s at a critical moment in its life.
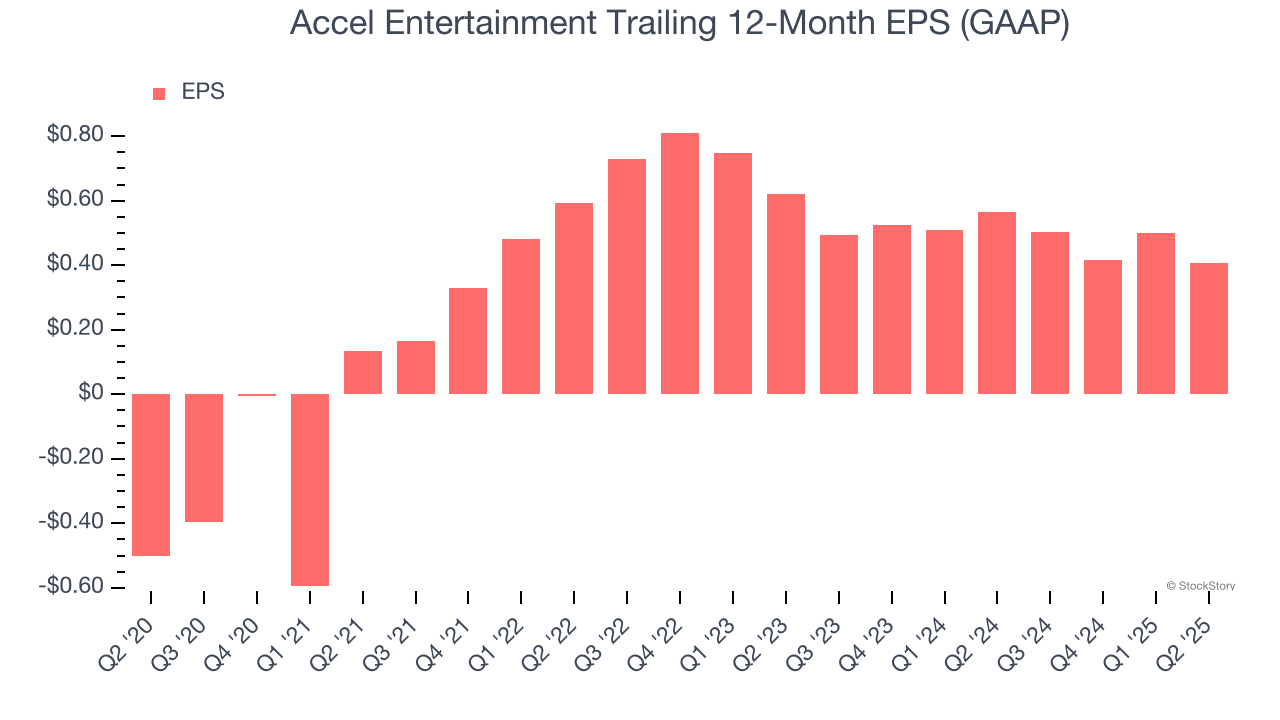
In Q2, Accel Entertainment reported EPS at $0.08, down from $0.17 in the same quarter last year. This print missed analysts’ estimates, but we care more about long-term EPS growth than short-term movements. We also like to analyze expected EPS growth based on Wall Street analysts’ consensus projections, but there is insufficient data.
Key Takeaways from Accel Entertainment’s Q2 Results
It was good to see Accel Entertainment beat analysts’ video gaming terminals sold expectations this quarter. We were also happy its revenue narrowly outperformed Wall Street’s estimates. On the other hand, its EPS missed. Overall, this quarter could have been better. The stock traded down 3.5% to $11.96 immediately after reporting.
Accel Entertainment’s latest earnings report disappointed. One quarter doesn’t define a company’s quality, so let’s explore whether the stock is a buy at the current price. The latest quarter does matter, but not nearly as much as longer-term fundamentals and valuation, when deciding if the stock is a buy. We cover that in our actionable full research report which you can read here, it’s free.