
Earnings results often indicate what direction a company will take in the months ahead. With Q2 behind us, let’s have a look at Caesars Entertainment (NASDAQ: CZR) and its peers.
Casino operators enjoy limited competition because gambling is a highly regulated industry. These companies can also enjoy healthy margins and profits. Have you ever heard the phrase ‘the house always wins’? Regulation cuts both ways, however, and casinos may face stroke-of-the-pen risk that suddenly limits what they can or can't do and where they can do it. Furthermore, digitization is changing the game, pun intended. Whether it’s online poker or sports betting on your smartphone, innovation is forcing these players to adapt to changing consumer preferences, such as being able to wager anywhere on demand.
The 9 casino operator stocks we track reported a mixed Q2. As a group, revenues beat analysts’ consensus estimates by 2.8%.
Thankfully, share prices of the companies have been resilient as they are up 5.4% on average since the latest earnings results.
Caesars Entertainment (NASDAQ: CZR)
Formerly Eldorado Resorts, Caesars Entertainment (NASDAQ: CZR) is a global gaming and hospitality company operating numerous casinos, hotels, and resort properties.
Caesars Entertainment reported revenues of $2.91 billion, up 2.7% year on year. This print exceeded analysts’ expectations by 1.2%. Despite the top-line beat, it was still a slower quarter for the company with a significant miss of analysts’ EPS and adjusted operating income estimates.
Tom Reeg, Chief Executive Officer of Caesars Entertainment, Inc., commented, “Our Caesars Digital segment posted one of its strongest quarters ever, as momentum continues to build toward the financial goals that we originally laid out in 2021. In Las Vegas, we posted solid gaming results in the face of softer market demand in our hospitality verticals. Net Revenues in our Regional segment increased 4% driven primarily by Caesars Virginia and New Orleans, coupled with strategic reinvestment into our Caesars Rewards database.”
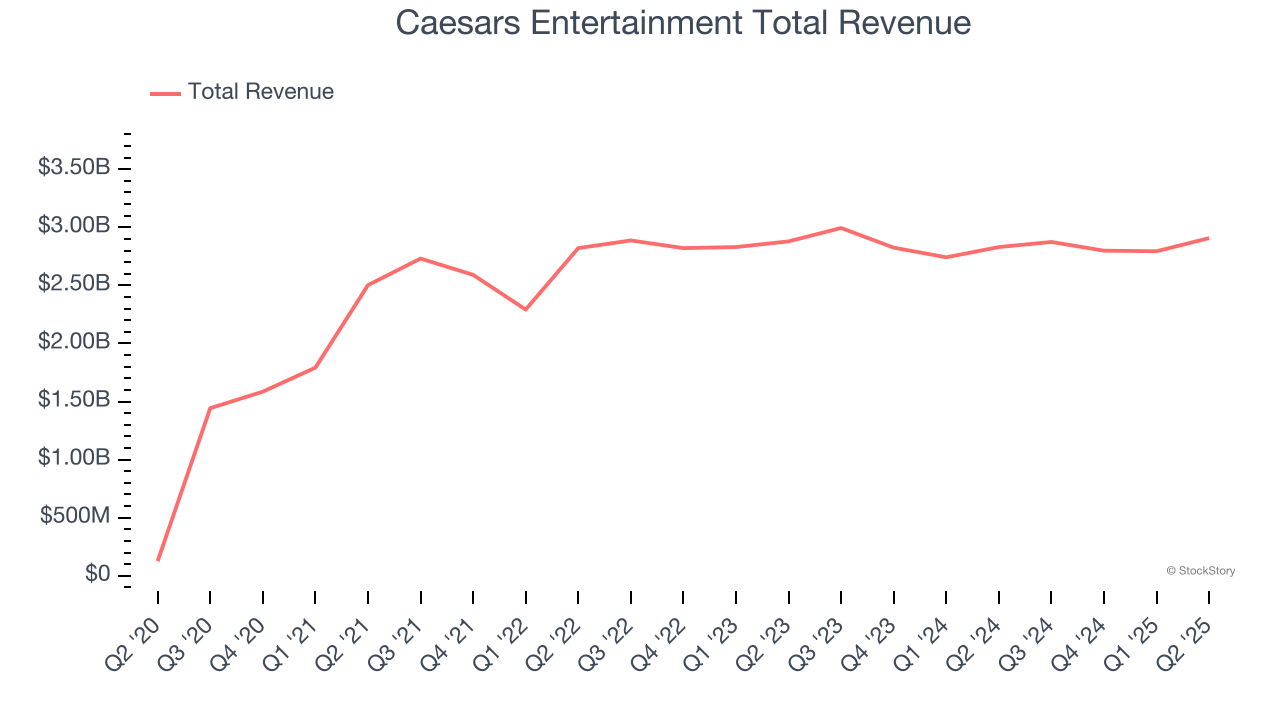
Unsurprisingly, the stock is down 7.7% since reporting and currently trades at $26.25.
Read our full report on Caesars Entertainment here, it’s free.
Best Q2: Red Rock Resorts (NASDAQ: RRR)
Founded in 1976, Red Rock Resorts (NASDAQ: RRR) operates a range of casino resorts and entertainment properties, primarily in the Las Vegas metropolitan area.
Red Rock Resorts reported revenues of $526.3 million, up 8.2% year on year, outperforming analysts’ expectations by 8.4%. The business had an exceptional quarter with an impressive beat of analysts’ adjusted operating income estimates.
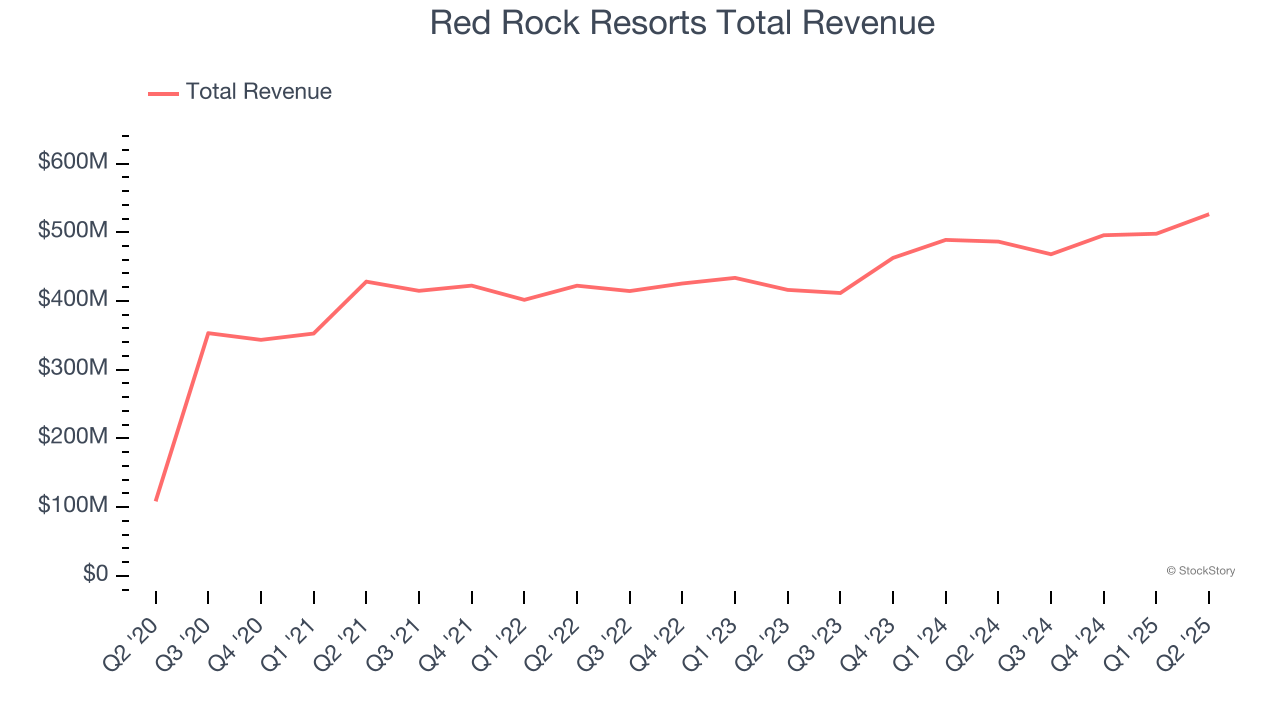
Red Rock Resorts delivered the biggest analyst estimates beat among its peers. The market seems happy with the results as the stock is up 10% since reporting. It currently trades at $60.46.
Is now the time to buy Red Rock Resorts? Access our full analysis of the earnings results here, it’s free.
Weakest Q2: Wynn Resorts (NASDAQ: WYNN)
Founded by the former Mirage Resorts CEO, Wynn Resorts (NASDAQ: WYNN) is a global developer and operator of high-end hotels and casinos, known for its luxurious properties and premium guest services.
Wynn Resorts reported revenues of $1.74 billion, flat year on year, falling short of analysts’ expectations by 0.6%. It was a softer quarter as it posted and a significant miss of analysts’ EPS estimates.
Interestingly, the stock is up 19% since the results and currently trades at $127.50.
Read our full analysis of Wynn Resorts’s results here.
Monarch (NASDAQ: MCRI)
Established in 1993, Monarch (NASDAQ: MCRI) operates luxury casinos and resorts, offering high-end gaming, dining, and hospitality experiences.
Monarch reported revenues of $136.9 million, up 6.8% year on year. This result topped analysts’ expectations by 5.4%. Overall, it was an exceptional quarter as it also logged a beat of analysts’ EPS and adjusted operating income estimates.
The stock is up 19.7% since reporting and currently trades at $104.44.
Read our full, actionable report on Monarch here, it’s free.
Boyd Gaming (NYSE: BYD)
Run by the Boyd family, Boyd Gaming (NYSE: BYD) is a diversified operator of gaming entertainment properties across the United States, offering casino games, hotel accommodations, and dining.
Boyd Gaming reported revenues of $1.03 billion, up 6.9% year on year. This print beat analysts’ expectations by 5.4%. It was a very strong quarter as it also put up and a beat of analysts’ EPS estimates.
The stock is up 2.1% since reporting and currently trades at $84.24.
Read our full, actionable report on Boyd Gaming here, it’s free.
Market Update
The Fed’s interest rate hikes throughout 2022 and 2023 have successfully cooled post-pandemic inflation, bringing it closer to the 2% target. Inflationary pressures have eased without tipping the economy into a recession, suggesting a soft landing. This stability, paired with recent rate cuts (0.5% in September 2024 and 0.25% in November 2024), fueled a strong year for the stock market in 2024. The markets surged further after Donald Trump’s presidential victory in November, with major indices reaching record highs in the days following the election. Still, questions remain about the direction of economic policy, as potential tariffs and corporate tax changes add uncertainty for 2025.
Want to invest in winners with rock-solid fundamentals? Check out our Top 6 Stocks and add them to your watchlist. These companies are poised for growth regardless of the political or macroeconomic climate.
StockStory is growing and hiring equity analyst and marketing roles. Are you a 0 to 1 builder passionate about the markets and AI? See the open roles here.


