
Paycom currently trades at $219.02 per share and has shown little upside over the past six months, posting a small loss of 0.5%. The stock also fell short of the S&P 500’s 9.7% gain during that period.
Does this present a buying opportunity for PAYC? Or is its underperformance reflective of its story and business quality? Find out in our full research report, it’s free.
Why Does Paycom Spark Debate?
Pioneering the concept of employees doing their own payroll with its "Beti" technology, Paycom (NYSE: PAYC) provides cloud-based human capital management software that helps businesses manage the entire employment lifecycle from recruitment to retirement.
Two Positive Attributes:
1. Elite Gross Margin Powers Best-In-Class Business Model
Software is eating the world. It’s one of our favorite business models because once you develop the product, it usually doesn’t cost much to provide it as an ongoing service. These minimal costs can include servers, licenses, and certain personnel.
Paycom’s gross margin is one of the highest in the software sector, an output of its asset-lite business model and strong pricing power. It also enables the company to fund large investments in new products and sales during periods of rapid growth to achieve higher profits in the future. As you can see below, it averaged an elite 86.2% gross margin over the last year. Said differently, roughly $86.17 was left to spend on selling, marketing, and R&D for every $100 in revenue. 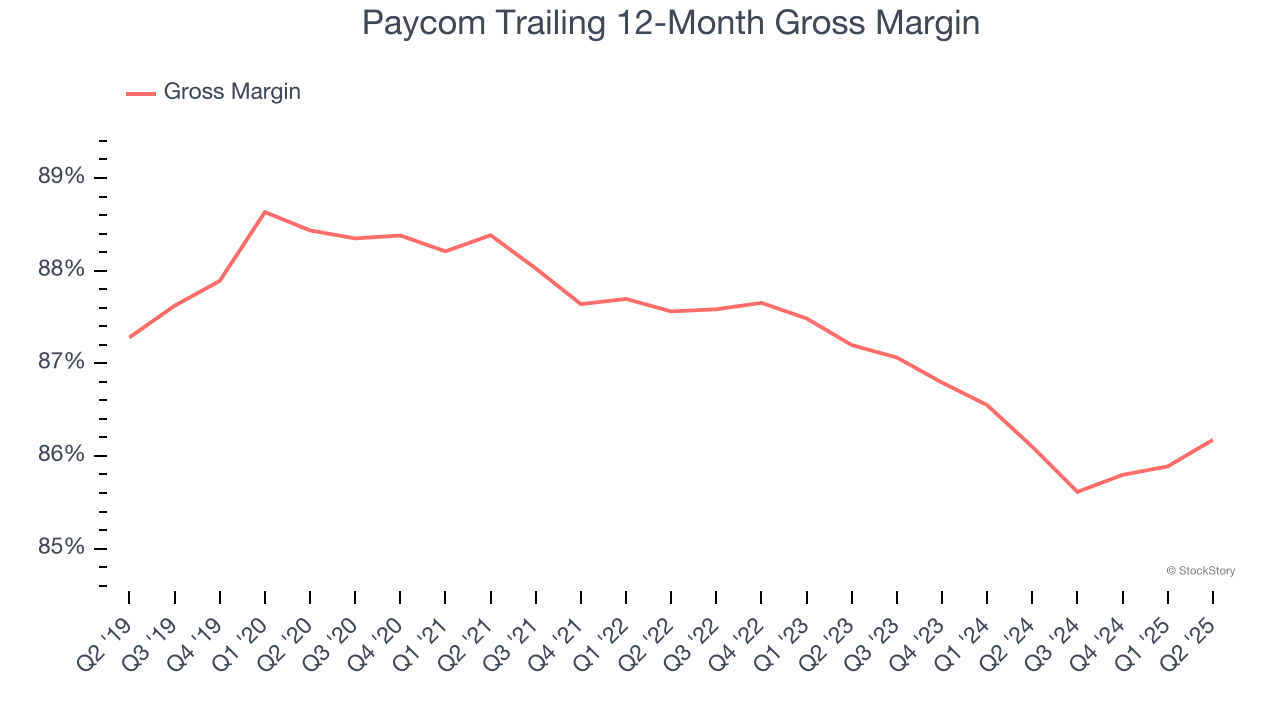
2. Customer Acquisition Costs Are Recovered in Record Time
The customer acquisition cost (CAC) payback period measures the months a company needs to recoup the money spent on acquiring a new customer. This metric helps assess how quickly a business can break even on its sales and marketing investments.
Paycom is extremely efficient at acquiring new customers, and its CAC payback period checked in at 9.2 months this quarter. The company’s rapid recovery of its customer acquisition costs means it can attempt to spur growth by increasing its sales and marketing investments. 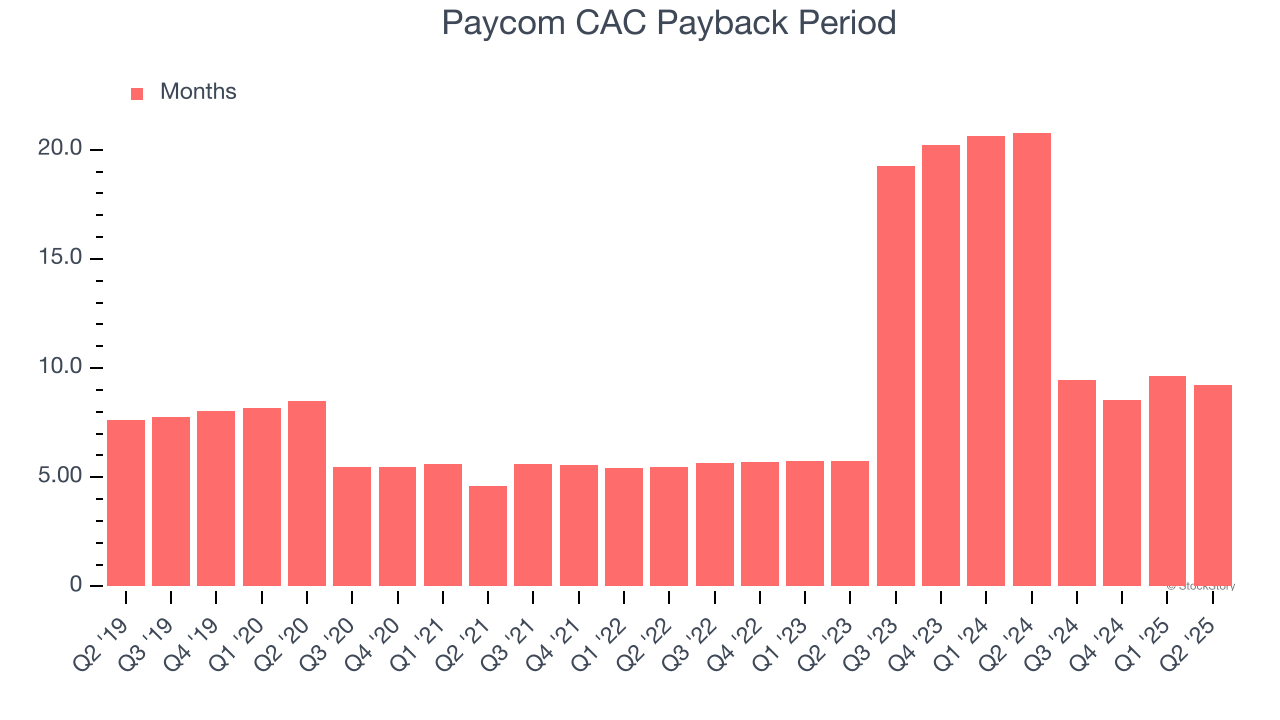
One Reason to be Careful:
Weak Billings Point to Soft Demand
Billings is a non-GAAP metric that is often called “cash revenue” because it shows how much money the company has collected from customers in a certain period. This is different from revenue, which must be recognized in pieces over the length of a contract.
Paycom’s billings came in at $484.6 million in Q2, and over the last four quarters, its year-on-year growth averaged 9.7%. This performance slightly lagged the sector and suggests that increasing competition is causing challenges in acquiring/retaining customers. 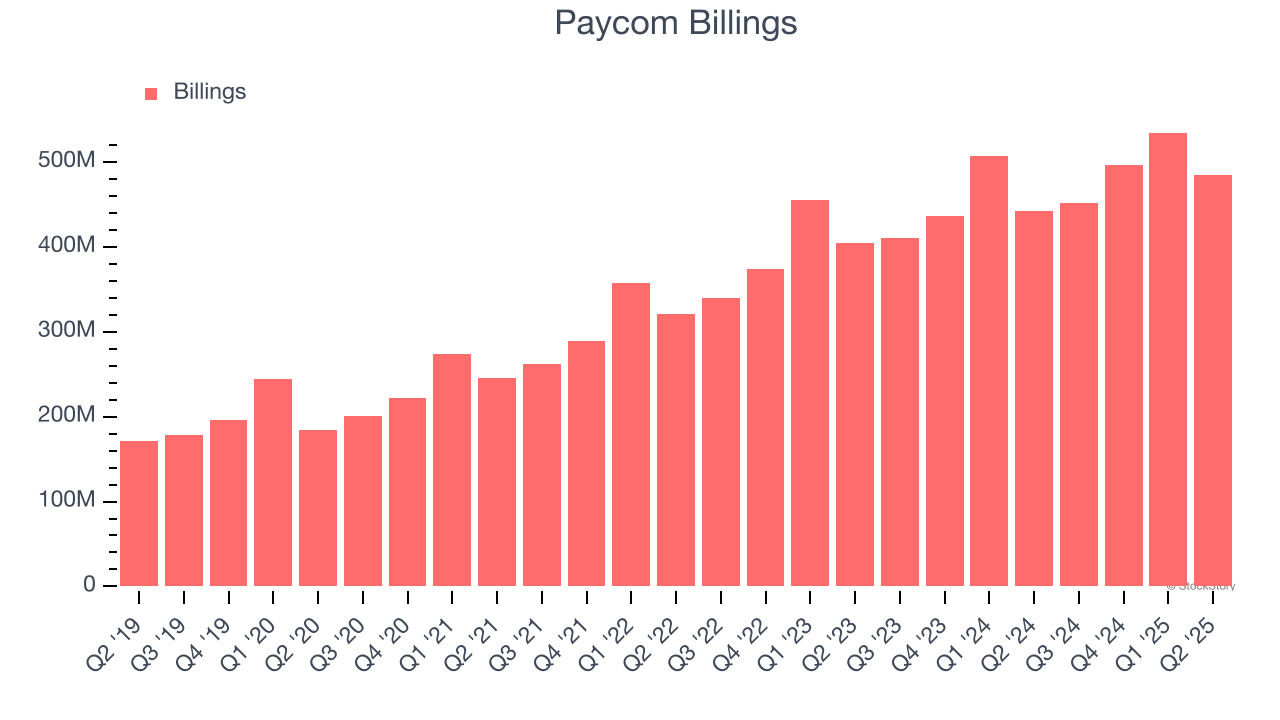
Final Judgment
Paycom’s merits more than compensate for its flaws. With its shares trailing the market in recent months, the stock trades at 5.8× forward price-to-sales (or $219.02 per share). Is now the time to initiate a position? See for yourself in our comprehensive research report, it’s free.
High-Quality Stocks for All Market Conditions
Trump’s April 2025 tariff bombshell triggered a massive market selloff, but stocks have since staged an impressive recovery, leaving those who panic sold on the sidelines.
Take advantage of the rebound by checking out our Top 5 Strong Momentum Stocks for this week. This is a curated list of our High Quality stocks that have generated a market-beating return of 183% over the last five years (as of March 31st 2025).
Stocks that made our list in 2020 include now familiar names such as Nvidia (+1,545% between March 2020 and March 2025) as well as under-the-radar businesses like the once-small-cap company Comfort Systems (+782% five-year return). Find your next big winner with StockStory today.
StockStory is growing and hiring equity analyst and marketing roles. Are you a 0 to 1 builder passionate about the markets and AI? See the open roles here.