
We’re all familiar with the story of Icarus, who flew too close to the sun and faced the consequences. Stocks sometimes face a similar fate when they ascend too high too quickly, only to suffer a stark decline shortly after that.
Thankfully, investors have tools that provide hints when a soaring stock is due for a decline or if a beaten-down stock is due for a bounceback. These are known as overbought or oversold conditions, and technical analysis is used to locate them.
Overbought Conditions
Sometimes, a stock chart looks more like an Olympic ski slope than a series of asset prices. When a security’s price increases quickly and forcefully, cautious investors seek overbought signals that could precede a pullback.
How can we tell when a stock is overbought? Certain technical indicators can light the way, especially ones designed to look for changes in momentum. Overbought stocks may have volatile price movements or volume changes that are best picked up by indicators like the Relative Strength Index (RSI). Here are a few commonly used indicators and the readings that indicate overbought status:
- Relative Strength Index (RSI) - Uses average gains and losses over 14 days to track momentum on a scale of 0 to 100. An RSI reading over 70 may indicate overbought, but some analysts prefer higher values like 80.
- Stochastic Oscillator - Similar to RSI, but uses 2 variables (closing prices and 3-day moving average of closing prices) to track momentum as multiple variables can help smooth data sequences. It also uses a 0 to 100 scale, with 80 indicating overbought.
- Bollinger Bands - The 20-day moving average of an asset price enveloped by upper and lower bound lines set 2 standard deviations from the central line. When the asset price breaks the upper bound, it could imply overbought conditions.
Oversold Conditions
If investors can become irrationally exuberant about the upside, it stands to reason they might also become overly pessimistic about the downside. When a stock drops rapidly despite solid fundamentals or a previously strong uptrend, it could enter oversold territory and become a buying opportunity for savvy investors.
Oversold conditions can be found using the same technical tools as overbought, just with the opposite sides of the spectrum. For example, on the RSI scale of 1 to 100, readings of 30 or below could indicate an oversold asset. On the stochastic oscillator, readings of 20 or below are generally considered oversold. Finally, Bollinger Bands demonstrate an oversold stock when the price pierces the lower bound line.
Note that overbought and oversold readings aren’t guaranteed to precede price trend reversals. Using multiple indicators together can increase accuracy, but technical analysis isn’t perfect and overbought or oversold stocks can behave erratically, especially in volatile markets or stock sectors.
The Difference Between Overbought and Oversold Conditions
Overbought and oversold conditions aren’t just lines on technical indicators. Market sentiment and investor psychology also play a prominent role in sustaining price pressure until stocks reach a saturation point. Here are 2 factors to consider when looking for overbought or oversold reversals.
Market Sentiment
If markets were completely efficient, stocks would likely reverse course long before they entered overbought or oversold territory as rational investors took profits. But when a stock makes a parabolic move (especially to the upside), it’s hard for investors to separate emotional thinking from careful investment planning. Overbought means excessive optimism is setting in; likewise, pessimism with oversold securities.
Market sentiment can be a double-edged sword. The same factors that cause a stock to reach overbought or oversold status can also hold the price there longer than investors anticipate. Stocks can trend at these levels for weeks or even months, frustrating technical traders and draining portfolios.
Price Action and Trends
Overbought and oversold stocks are characterized by steep and abrupt price movements, with significant gains or losses occurring in brief periods. The charts of these stocks are easy to identify; the price action is practically vertical, and the volume is mostly going in one direction. Stock price gaps are often present as well.
Overbought price action looks like a steep line upward, while oversold price action is equally steep to the downside. The price action often looks unsustainable even before further analysis, but remember that sentiment and trend can result in false positive signals from technical indicators.
Real-World Examples of Overbought and Oversold Conditions
Stocks often enter overbought or oversold territory during volatile periods like the Great Recession or the 2020 COVID crash. In fact, the same stock can waver from overbought to oversold in a relatively brief period when markets are uncertain.
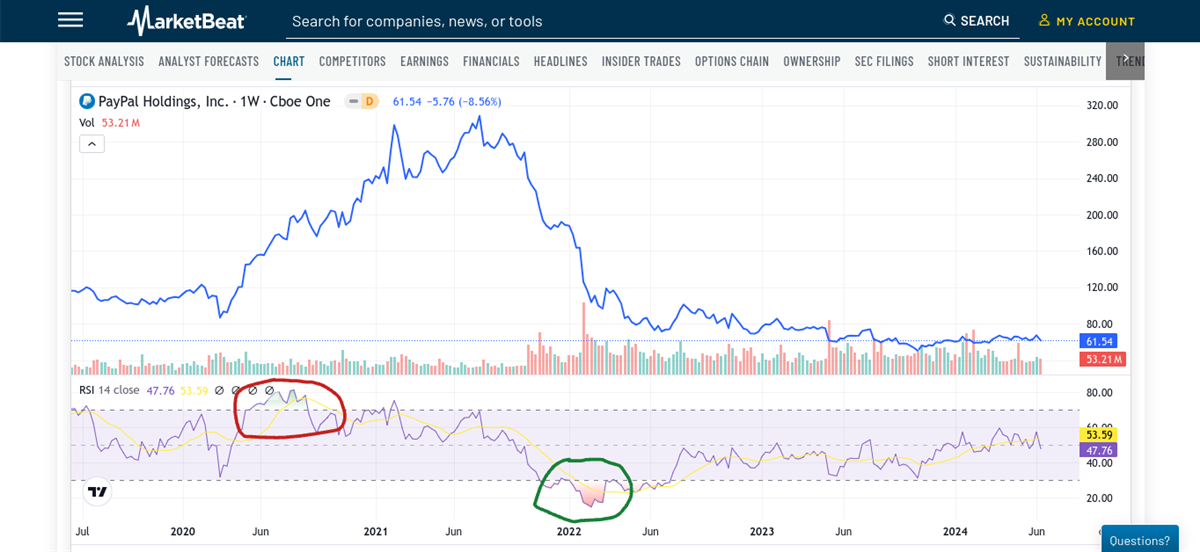
Take PayPal Holdings Inc. (NASDAQ: PYPL), for instance, which bounced from overbought to oversold in about 18 months during the COVID-19 pandemic.
PYPL shares skyrocketed during the COVID market recovery, bouncing from a low of $85 in March 2020 to $300 by February 2021. During the parabolic upward move, the RSI triggered an overbought signal twice, first in mid-2020 and again in early 2021. The stock peaked in late 2021 and crashed hard into 2022.
In early 2022, the RSI triggered an oversold signal near 20 as the stock price dropped below the COVID lows. But despite this strong signal, a rebound never materialized. In fact, PYPL shares still haven’t rebounded to post-COVID levels and remain range-bound as of this writing, more than 2 years after the oversold RSI signal.
Overbought and Oversold are Useful Signals, But Not Crystal Balls
The PYPL example above highlights both the strengths and weaknesses of technical signals like overbought and oversold. Sometimes, these indicators trigger buy or sell signals before the price action changes course; other times, they send a false alarm, and the asset price continues along its current trajectory.
No single indicator or market signal has a 100% success rate. Every investor must learn to handle losses and stick to their plan. Technical trading features like overbought and oversold provide plenty of helpful hints but should be part of a comprehensive process. Never rely on just 1 or 2 tools in your investment analysis.
Invest Wisely with Insights from MarketBeat
Are you looking to learn more about technical analysis? MarketBeat has the educational resources you need to get started today. Click here to learn more.
