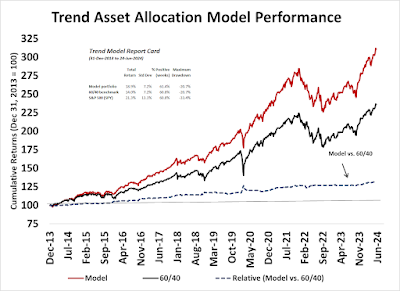
The Trend Asset Allocation Model is an asset allocation model that applies trend-following principles based on the inputs of global stock and commodity prices. This model has a shorter time horizon and tends to turn over about 4-6 times a year. The performance and full details of a model portfolio based on the out-of-sample signals of the Trend Model can be found here.

My inner trader uses a trading model, which is a blend of price momentum (is the Trend Model becoming more bullish, or bearish?) and overbought/oversold extremes (don't buy if the trend is overbought, and vice versa). Subscribers receive real-time alerts of model changes, and a hypothetical trading record of the email alerts is updated weekly here. The hypothetical trading record of the trading model of the real-time alerts that began in March 2016 is shown below.

The latest signals of each model are as follows:
- Ultimate market timing model: Buy equities (Last changed from “sell” on 28-Jul-2023)*
- Trend Model signal: Bullish (Last changed from “neutral” on 28-Jul-2023)*
- Trading model: Neutral (Last changed from “bullish” on 23-May-2024)*
Update schedule: I generally update model readings on my site on weekends. I am also on X/Twitter at @humblestudent. Subscribers receive real-time alerts of trading model changes, and a hypothetical trading record of those email alerts is shown here.
Subscribers can access the latest signal in real time here. Farrell’s Rule 2 in actionThe recent action in the financial markets appears to be a case of Bob Farrell’s Rule 2 in action: “Excess moves in one direction will lead to an excess move in the opposite direction”.U.S. equity investors saw a sudden and violent rotation from growth to value stocks and from large caps to small caps. But that’s not the entire story.
The risk unwind is also evident in the currency markets. The Japanese Yen strengthened against the USD, which is a sign of a carry trade unwind. The bottom panel shows the long Mexican Peso/short Japanese Yen carry trade of buying a high yielding currency while shorting the low yielding currency, which also reversed itself. What’s remarkable is the correlation the currency markets have shown to U.S. equity prices (top panel) and the equity factor of long NASDAQ and short small caps (bottom panel).
The sudden nature and magnitude of these market moves is a sign of the crowding and leverage in hedge fund positioning. When it unwinds, volatility rises and VaR, or risk model Value at Risk, falls, which forces traders to reduce their positions.
What happens next? The full post can be found here.