

The latest RRG chart shows growth sectors (technology, communication services) and selected defensive sectors (consumer staples, healthcare, REITs) in the top half of the chart, indicating leadership positions. Value and cyclical sectors are the laggards in the bottom half.
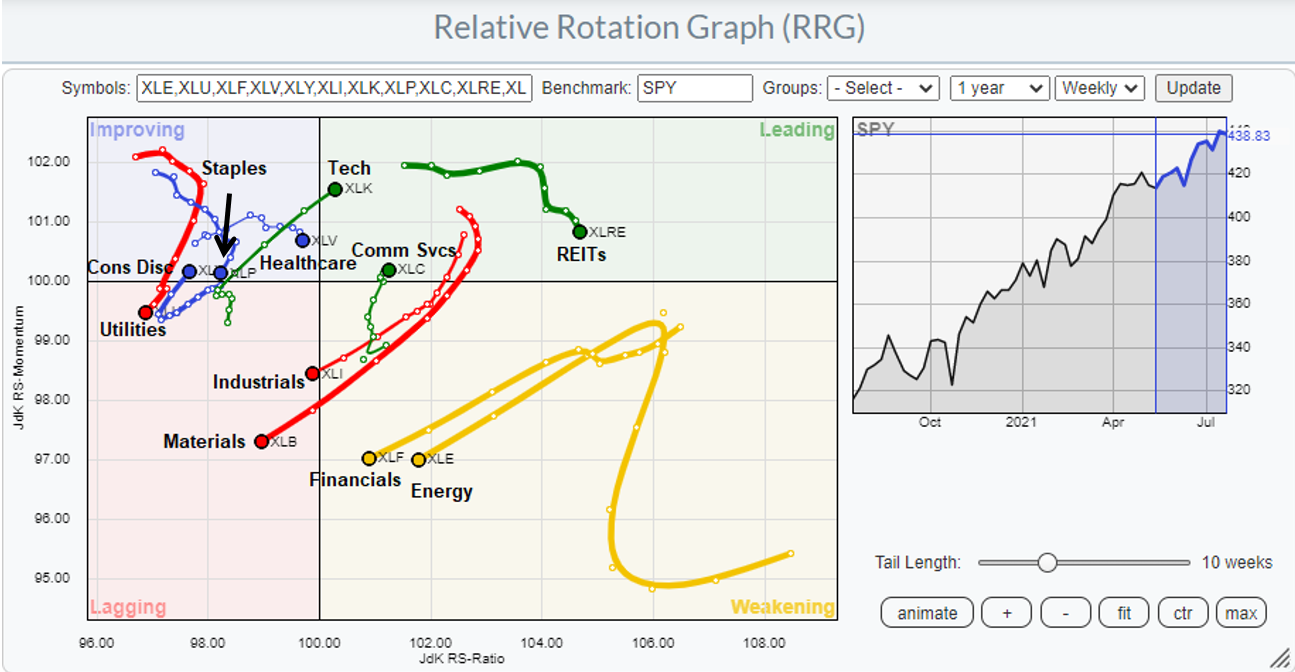
While the RRG snapshot is technically correct. A more detailed factor and sector review reveal a more nuanced picture of the market`s leadership evolution.
The full post can be found here.
