
 ( click to enlarge )
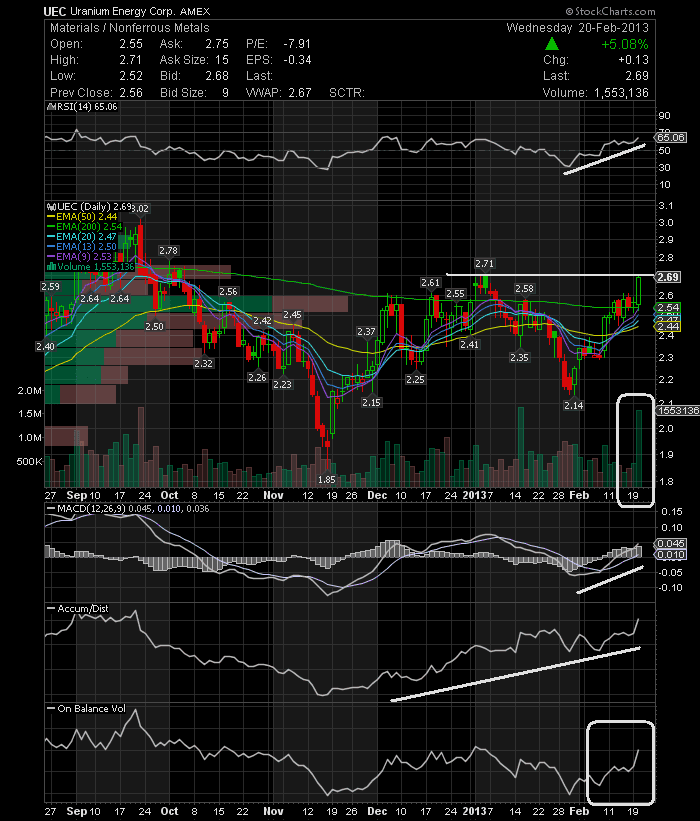
Uranium Energy Corp. (NYSEAMEX:UEC) has a chart set to breakout. Today, the stock traded more than 1.5 million shares, three times higher than average and ran as high as 6% from Tuesday’s close. I strongly believe this bullish momentum to continue into tomorrow’s trading session. From a technical standpoint, the stock has an up trending MACD, indicating potential accumulation and an up-trending RSI at 65 indicating room for potential further gains. In addition, the accumul/distrib line shows a significant uptrend and OBV reveals very strong buying pressure. UEC needs to be at the top of your watch list tomorrow.
I recomend : Benzinga Pro : Real-time news and data feed delivered at blazing fast speeds and designed specifically for traders. Sign up Now
 ( click to enlarge )
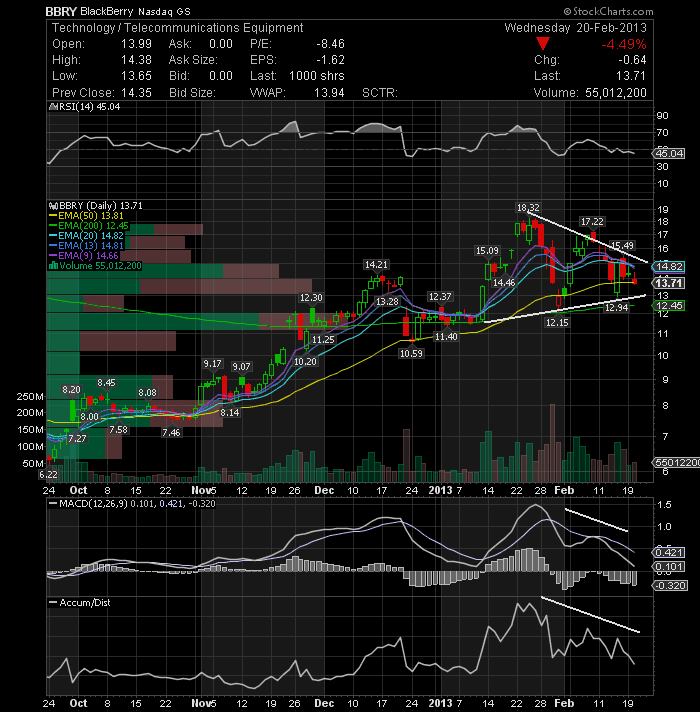
Research In Motion Ltd (NASDAQ:BBRY) Symmetrical triangle still holding on the daily, no clear indication of direction yet. However, there are some negative divergences in the daily indicators, showing signs of some weakness. So, $13 is a key support level to keep an eye on.
 ( click to enlarge )
General Dynamics Corporation (NYSE:GD) is testing a resistance line in the 67.12 area, a break of which could signal a trend reversal.
 ( click to enlarge )
Infoblox Inc (NYSE:BLOX) New bullish MACD cross has occurred on the daily chart. Breakout watch over $20
 ( click to enlarge )
Netflix, Inc. (NASDAQ:NFLX) Some technical indicators are showing some weakness. Bearish MACD crossover on daily chart today.
During the day I tweet many times to my readers. I encourage everybody to subscribe AC Investor Blog twitter and newsletter, so you can receive my trade ideas and stock news in real time.
Disclaimer : This is not an investment advisory, and should not be used to make investment decisions. Information in AC Investor Blog is often opinionated and should be considered for information purposes only. No stock exchange anywhere has approved or disapproved of the information contained herein. There is no express or implied solicitation to buy or sell securities. The charts provided here are not meant for investment purposes and only serve as technical examples. Don't consider buying or selling any stock without conducting your own due diligence.
Thanks for visiting AC Investor Blog.
AC
