
In part one of this series, we looked at when the Fed's taper was likely to start and why another taper tantrum wasn't likely.
Now it's time to take a look at the two most important facts about the Fed's taper plans. Facts that could help you avoid losing a small fortune, and missing out on one of the best bull markets in US history.
Fact 3: The Fed's Bond-Buying Is NOT Directly Inflating Stock PricesOne of the most common misconceptions about the Fed's bond-buying is that the Fed is intentionally trying to push up stock prices.
The plausible-sounding theory behind why the Fed might care about the market not falling fast or far is simple.
- a rising market makes Americans (the 50% that own stocks) fell richer
- and thus more confident to spend more freely
- about 70% of GDP is driven by consumer spending
Now it's true that the biggest single component of the Michigan consumer confidence survey is now the short-term performance of the S&P 500.
However, a recent study from the Kansas City Fed actually found that the popular belief that the Fed is lowering rates to pump up stocks could be 180 degrees the opposite.
According to the K-Fed, it's the savings glut of the rich that's primarily driving down interest rates, and not the Fed's bond-buying. In other words, the reason for rising wealth inequality looks more like this
- the 1% (who have lots of stocks options) get richer as the market rises
- they sell their stock creating large excess savings
- some of that savings goes into risk-free assets, ie treasuries, pushing down interest rates
- this partially drives stocks higher, in a kind of virtuous cycle
Now the Fed's taper plans, according to JPMorgan would still result in $600 to $1 trillion of extra bond buying.
Many investors understandably believe that this is "money printing" and driving a major market bubble.
With the Fed set to potentially buy $5 to $6 trillion of bonds by the time all is said and done, how could we not be in a major market bubble?

After all, with many analysts now expecting the Fed to not start undoing QE until 2024 or later, isn't market inflation a virtual certainty?
Actually, the Fed's bond-buying is not directly going into stocks.
The Fed has never bought stocks but many people assume that all the new money created since the pandemic began must be going into stocks or at least a significant portion of it.
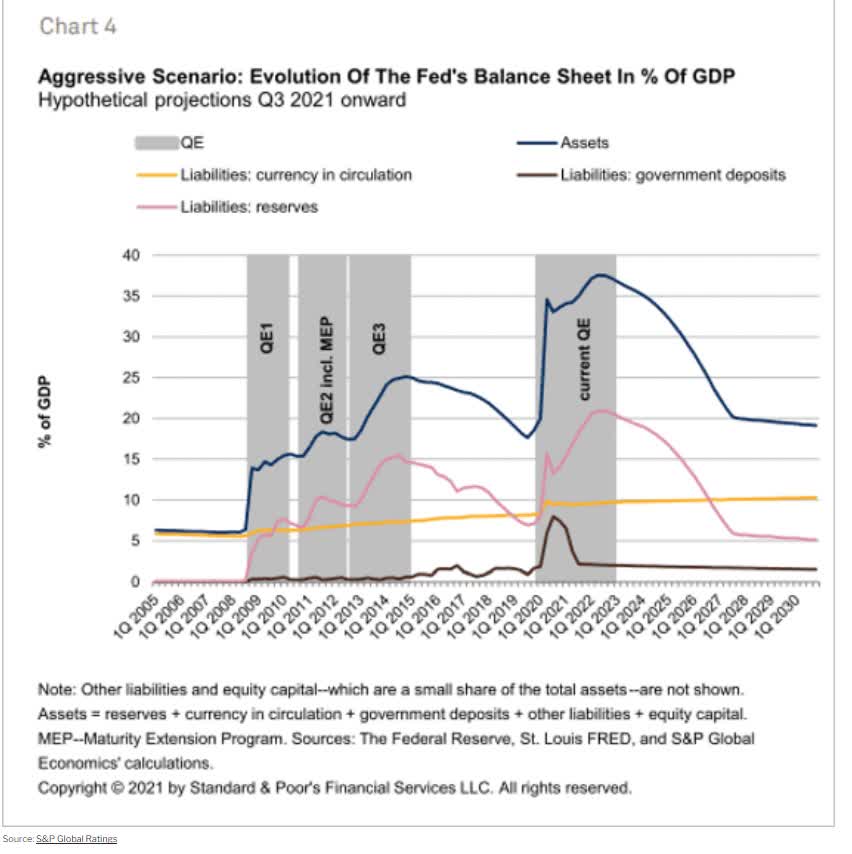
According to S&P's research the amount of currency in actual circulation within the economy, including digital dollars, has barely increased since QE infinity began.
What's more, it's not expected to increase significantly in the coming years, not even out to 2030.
The Fed's bond-buying is from large banks, and those printed dollars mostly end up sitting on bank balance sheets waiting to eventually, possibly, hopefully, get lent out to finance productive economic activity.
During the 2010s banks sitting on a mountain of bonds, partially due to higher capital requirements, is why the recovery was so much slower than we'd hoped for.
In other words, the Fed buying $10 billion in bonds from JPMorgan, doesn't mean JPMorgan is using that money to buy stocks, crypto, options, or almost any other risk asset.
So does that mean that investors can stop worrying about a taper-induced market downturn?
Fact 4: A "Painful" Correction Is Coming
(Source: Jill Mislinski)
The S&P hasn't seen a 5% pullback since October 2020. It's been not only a glorious 2021 rally but also one with some of the lowest volatility in history.
What this means for investors, is that any market downturn, such as the famous "taper tantrum" of 2013, whatever the cause, is likely to feel a lot more painful than it actually is.
Consider this. In 2013 the market was red hot. Day after day of record highs, and very little volatility (sound familiar?) had many investors feeling like David Portnoy, that stocks only go up.
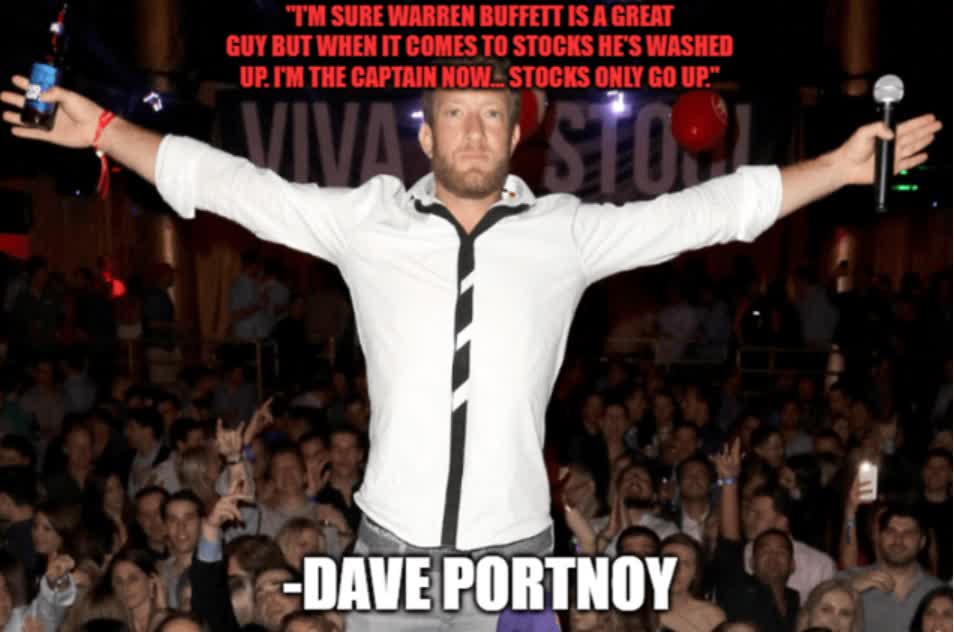
In fairness to Mr. Portnoy, he later clarified that he meant that "over the long-term stocks only go up" which is 100% accurate.
But the point is that in 2013 the market was euphoric and high on an epic low volatility rally that made almost all investors feel invincible.
That's why a 5.6% dip, over just one month, terrified so many and now creates this obsession with whether or not the Fed can prevent another "tantrum".
Thanks to talking about tapering to death, for months on end before the official taper is likely to start, a major correction is likely to be averted.
But the definition of a "major correction" is likely to be very different this year than most.

Since 1980 the average peak intra-year decline is 14.3%. And yet stocks go up 75% of all years.
In other words, investors in any given year should expect a 14% correction, and that would be 100% historically normal, not a "severe correction".
After the year we've had, not just 2021, but since March 23rd, 2020, even a 10% mild correction might feel like the apocalypse to some investors.
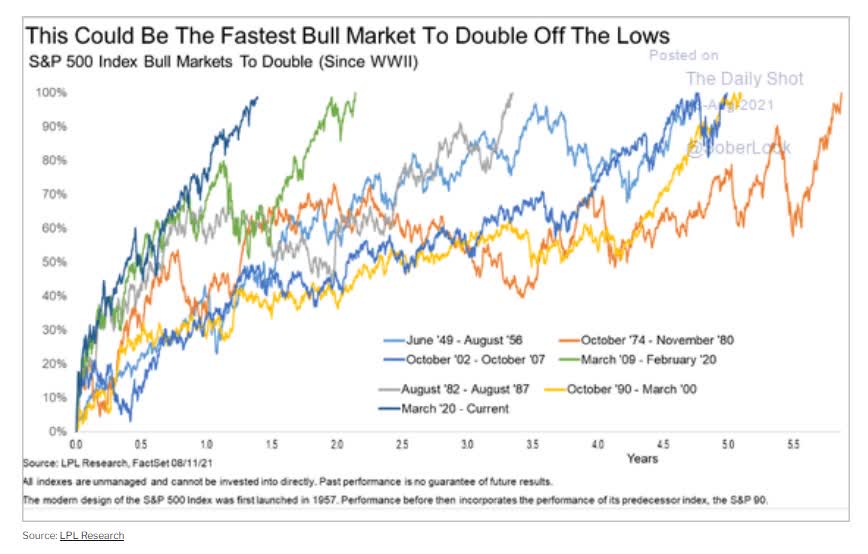
We're in the stronger bull market in history, at least the fastest to double off the lows.
And we've accomplished this with freakishly low volatility. It's commonly said that the Fed's bond-buying, stock price pumping has taught investors to instinctively "buy the dip".
Well, the most recent downturn was a 1.8% peak decline over 2 days. That's not even a dip, that's a mini-dip.
Another market downturn is inevitable, we just don't know the exact cause, or the time it will start.
Is the next pullback or correction, which to new investors might feel like a bear market, likely to have something to do with the Fed and interest rates? Very possible.
But a downturn is coming. And here's how you avoid making a costly mistake.
| DS Phoenix Portfolio Fundamentals | |
| Yield | 3.54% |
| LT Growth Forecast | 12.10% |
| Discount To Fair Value | 16% |
| 5-Year Annual Valuation Boost | 3.55% |
| 5-Year Consensus Total Return Potential | 19.19% |
| 5-Year Risk-Adjusted Expected Total Return | 14.03% |
| LT Consensus Total Return Potential | 15.64% |
| S&P 500 5-Year Risk-Adjusted Expected Return | 3.43% |
| DK Video Phoenix Risk-Adjusted Return/S&P 500 Risk-Adjusted Expected Return | 4.09 |
| S&P 500 Consensus LT Total Return Potential | 9.9% |
| Dividend Aristocrats Consensus LT Total Return Potential | 11.2% |
| Nasdaq Consensus LT Total Return Potential | 16.2% |
| DK Video Phoenix LT Consensus Total Return Potential/S&P 500 Consensus LT Total Return Potential | 158% |
| DK Video Phoenix LT Consensus Total Return Potential/Dividend Aristocrats Consensus LT Total Return Potential | 140% |
| DK Video Phoenix LT Consensus Total Return Potential/Nasdaq Consensus LT Total Return Potential | 97% |
| Annual Income | $43,146.40 |
| Average Monthly Income | $3,595.53 |
| Average Daily Income (Including Holidays) | $118.21 |
| Average Hourly Income | $4.93 |
| Average Income/Minute | $0.08 |
| Average Income/Second | $0.0014 |
(Source: Dividend Kings $1.2 million real-money portfolio tracker)
My $1.2 million retirement portfolio (1 of 4 I have) has a yield on cost of 4%, and analysts expect my companies to grow at over 12%, generating long-term returns of about 16% CAGR, similar to the Nasdaq.
But unlike the Nasdaq, which yields a pitiful 0.5%, I'm enjoying over $43,000 in safe annual dividends that are growing about 3X the rate of inflation.
That's 8 cents every single minute, of every day, including weekends and holidays.
Do you know how much terror I'll feel when the market next falls 5%, 10%, or even 15%? If I said "none" I'd be lying. We're all human and when we see our hard-earned savings vanishing quickly, even on paper, a part of us will always be tempted to "hit the sell button".
After all, we've now had 10 years of perma-bears and doomsday prophets predicting 50% to 70% or even 90% to 95% market crashes.
So the next time the market falls 5%, it's natural to fear it will fall 10%, or 15%, or 20%, or more.
This is where the power of safe high-yield investing comes in. A 3.5% yielding portfolio might not sound very exciting, even if translates into a river of safe income that can fund a rich retirement.
When the market is soaring higher, we can become euphoric, and feel invincible, just as investors felt in early 2018 and 2013.
I feel a bit of that euphoria too. How could I not when I just made $40K on paper in the last week?
But I'm smart enough to know that disciplined financial science is the easiest way to not only get rich on Wall Street but to stay that way over time.
When the market is rocketing higher, and I feel invincible, I remind myself that that $40K in paper gains is fleeting, but $43K in safe and growing annual dividends is what counts.
When the market falls 10% and I am starting at $120K in paper losses? I remind myself that "this too shall pass". Those $118 in daily dividends help me to keep a cool head.
And better yet, they help to replenish my elephant gun to buy during every market downturn.
When you train yourself to focus on what's real, fundamentals, such as $3,600 per month in dividends, it's much easier to avoid costly mistakes, such as the siren song of market timing.

Here's the truth about market timing, most people suck at it. From 2001 through 2020 the S&P 500 delivered 7.5% annual returns if you bought and held.
A 60/40 portfolio was nearly as good. A super conservative 40% stock and 60% bond portfolio 5.9%.
The average market timing investor received just 2.9%, barely ahead of inflation.
The market yields 1.4%, not enough for most people to live off the dividends.
The Nasdaq, 0.5% yield, is even worst.
Vanguard's "high-yield" ETF yields just 2.8%.
But if you combine the best hyper-growth blue-chips with safe yield blue-chips? Then you can achieve a safe 3% to 4.5% yielding portfolio with 12% to 20% growth forecasts.
In other words, you can have your income cake and eat it too. And over the long-term, with every market downturn driving even better fundamentals, you learn to cheer when markets slide.
That's the true trick to getting and staying rich on Wall Street. Not mastering market timing with meme stocks, crypto, NFTs, SPACs, or options. But merely mastering your emotions and disciplined financial science.
That's the math behind getting and staying rich on Wall Street. And it's what's made the greatest investors in history legends, and often billionaires.
SPY shares were trading at $452.72 per share on Friday morning, down $0.47 (-0.10%). Year-to-date, SPY has gained 21.88%, versus a % rise in the benchmark S&P 500 index during the same period.
About the Author: Adam Galas

Adam has spent years as a writer for The Motley Fool, Simply Safe Dividends, Seeking Alpha, and Dividend Sensei. His goal is to help people learn how to harness the power of dividend growth investing. Learn more about Adam’s background, along with links to his most recent articles.
The post 4 Things You Need to Know About the Fed's Taper: Part 2 appeared first on StockNews.com