
Energy Transfer LP (ET) continues to make headway with its proposed Lake Charles export plant in Louisiana, a development that has the potential to drive significant growth and enhance future cash flows.
ET has recently entered three non-binding agreements to sell liquefied natural gas (LNG) from Lake Charles despite the U.S. Department of Energy denying an extension to Lake Charles’ authorization to sell LNG to non-Free Trade Agreement (FTA) countries beyond December 2025.
In addition to the Lake Charles project, ET is pursuing expansion through strategic acquisitions and various ongoing development projects. Earlier this year, the acquisition of Lotus Midstream Operations, LLC was completed, bolstering the firm’s presence within the Permian Basin.
These proactive developments have helped ET’s stock gain steady momentum. It is currently trading above its 50-day and 200-day moving averages of $12.76 and $12.48, respectively.
However, the stock is still trading at a lower price than its fundamentals, making it appealing to investors. ET’s forward EV/Sales of 1.24x is 38.9% lower than the industry average of 2.02x, while its forward Price/Sales multiple of 0.50 is 64.8% lower than the industry average of 1.41.
On another positive note, Energy Transfer has proven its ability to provide a reliable passive income stream, offering a $1.23 annual dividend that yields 9.35% at the current share price. Its four-year average dividend yield is 10.35%.
Below are some key metrics trends that illustrate the potential inherent in ET and why purchasing its shares may prove worthwhile.
Examining Energy Transfer’s Significant Financial Growth and Fluctuation: 2020-2023
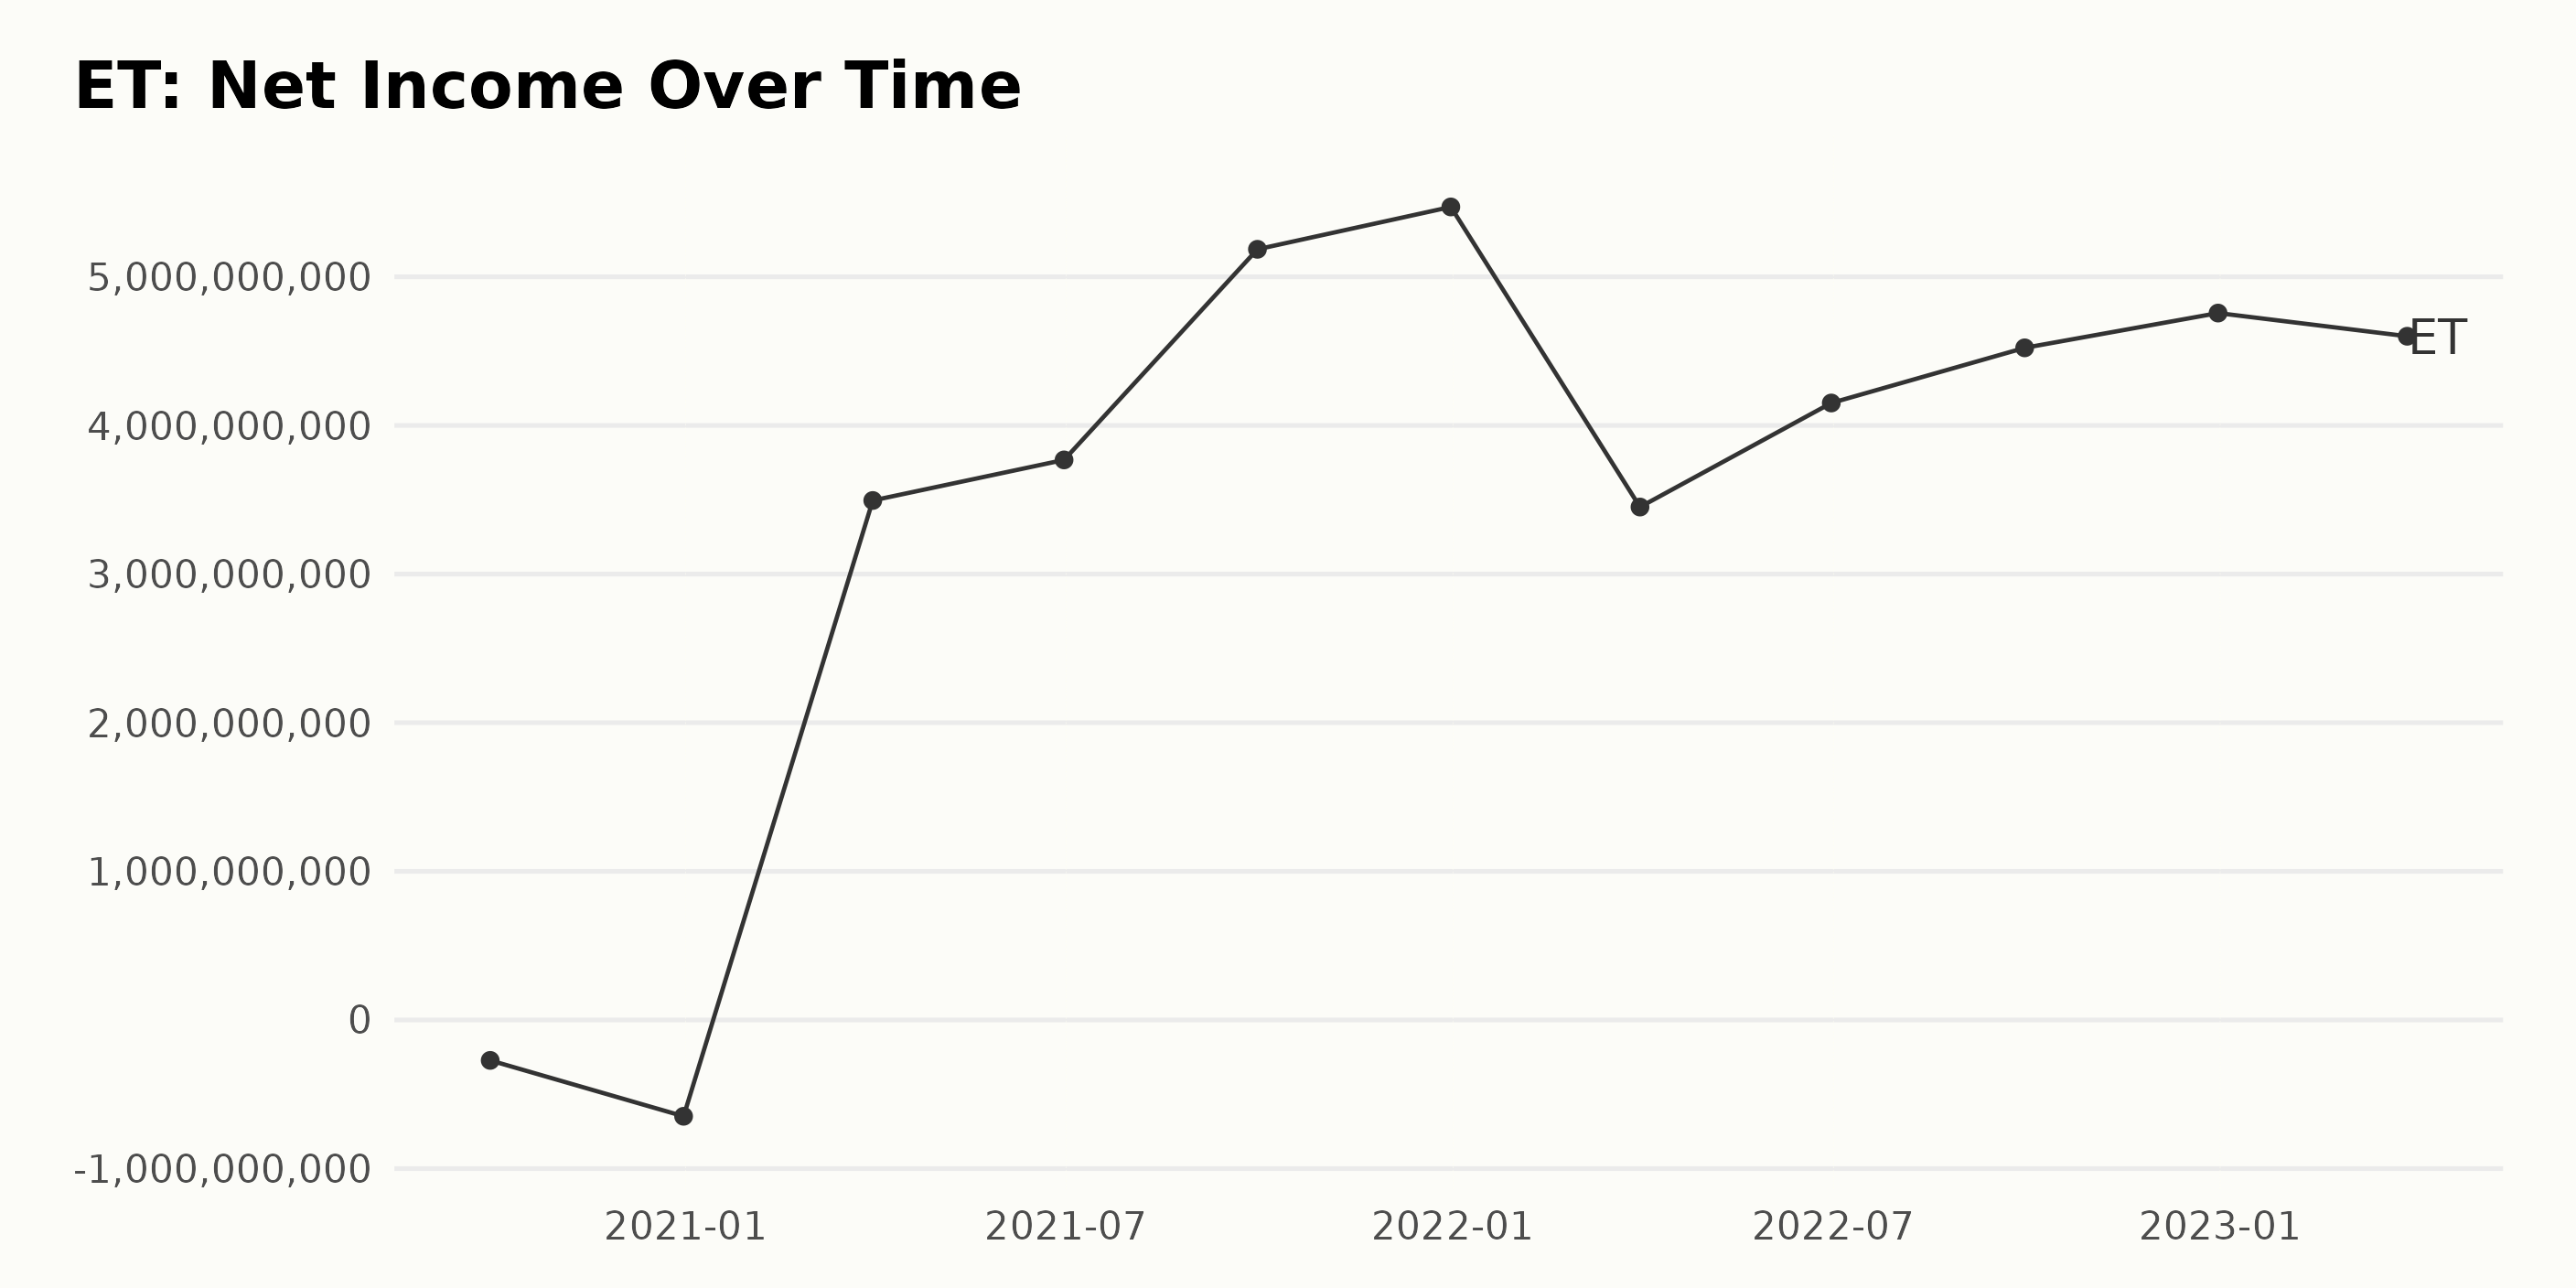
The trailing-12-month net income of ET has seen significant fluctuations:
- On September 30, 2020, the net income was at -$272 million.
- This downward trend accelerated as of December 31, 2020, when net income slipped to -$648 million. However, starting in 2021, there’s been a strong recovery and steady growth.
- By the end of the first quarter (March 31, 2021), the net income rebounded drastically to $3.49 billion.
- In the second quarter (June 30, 2021), it slightly increased to $3.77 billion.
- This upward growth continued in the third (September 30, 2021) and fourth quarters (December 31, 2021), reaching $5.19 billion and $5.47 billion, respectively.
- Despite a slight dip in the first quarter of 2022 ($3.45 billion), the consistent positive trend resumed through the end of the year.
- In the second quarter (June 30, 2022), net income increased to $4.15 billion.
- A further rise to $4.52 billion was recorded in the third quarter (September 30, 2022).
- By the fourth quarter (December 31, 2022), the figure had risen to $4.76 billion.
- By the first quarter of 2023, the net income decreased slightly to $4.6 billion, which is still considerably higher than at the start of this series.
This data series suggests a profound turnaround for ET, from significant losses in 2020 to substantial profits by 2023. Despite variations in quarterly performance, the overall growth rate from September 30, 2020, to March 31, 2023, shows a significant positive trend. Please note that the emphasis here is on the more recent figures, with the last value on March 31, 2023, being $4.6 billion, signifying a noteworthy contrast against the initial negative values in late 2020.
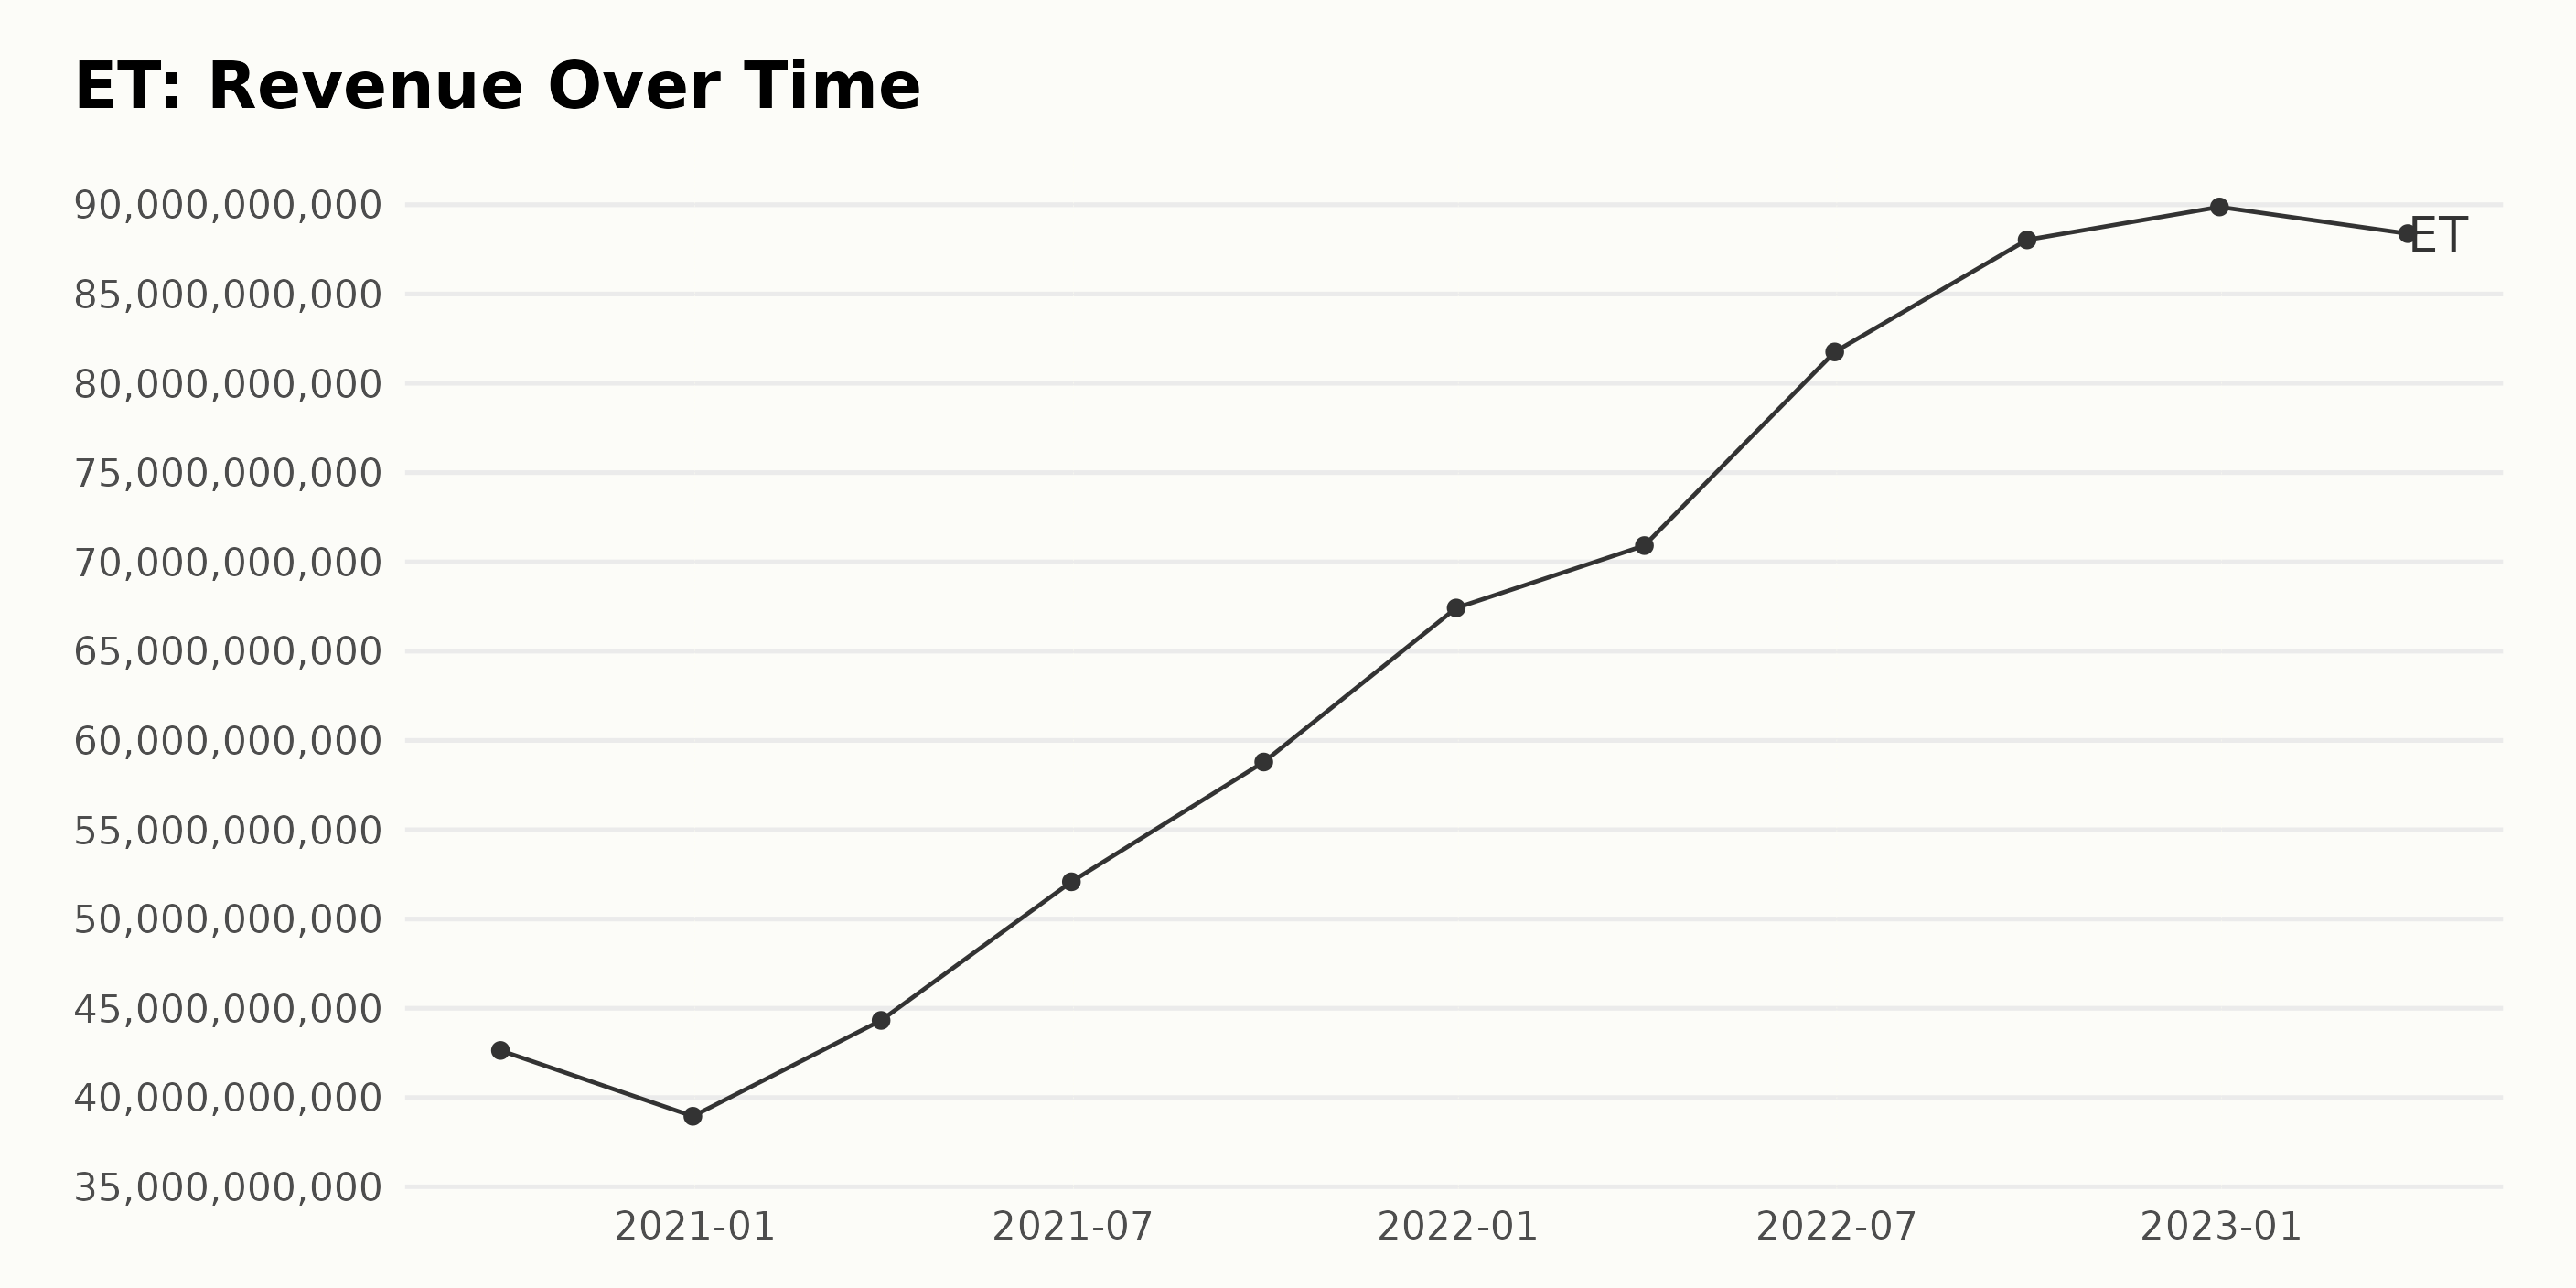
The trailing-12-month revenue of ET demonstrates an upward trend over the observed period with some intermittent fluctuations. Below is a summarised analysis:
- September 30, 2020: Revenue begins at $42.64 billion.
- December 31, 2020: Decline to $38.95 billion.
- March 31, 2021: Increase again to $44.32 billion, marking the start of a significant growth phase.
- June 30, 2021: Remarkable jump to $52.09 billion in revenue. This upward trend continues, with the recorded revenue reaching its pinnacle on December 31, 2022, when it attained an impressive $89.88 billion. After this peak, there’s a minor dip in the first quarter of 2023 to $88.38 billion.
In summary, the overall growth rate from September 30, 2020, to March 31, 2023, is around 107%, which signalizes a strong upward trend in ET’s revenue over the period.
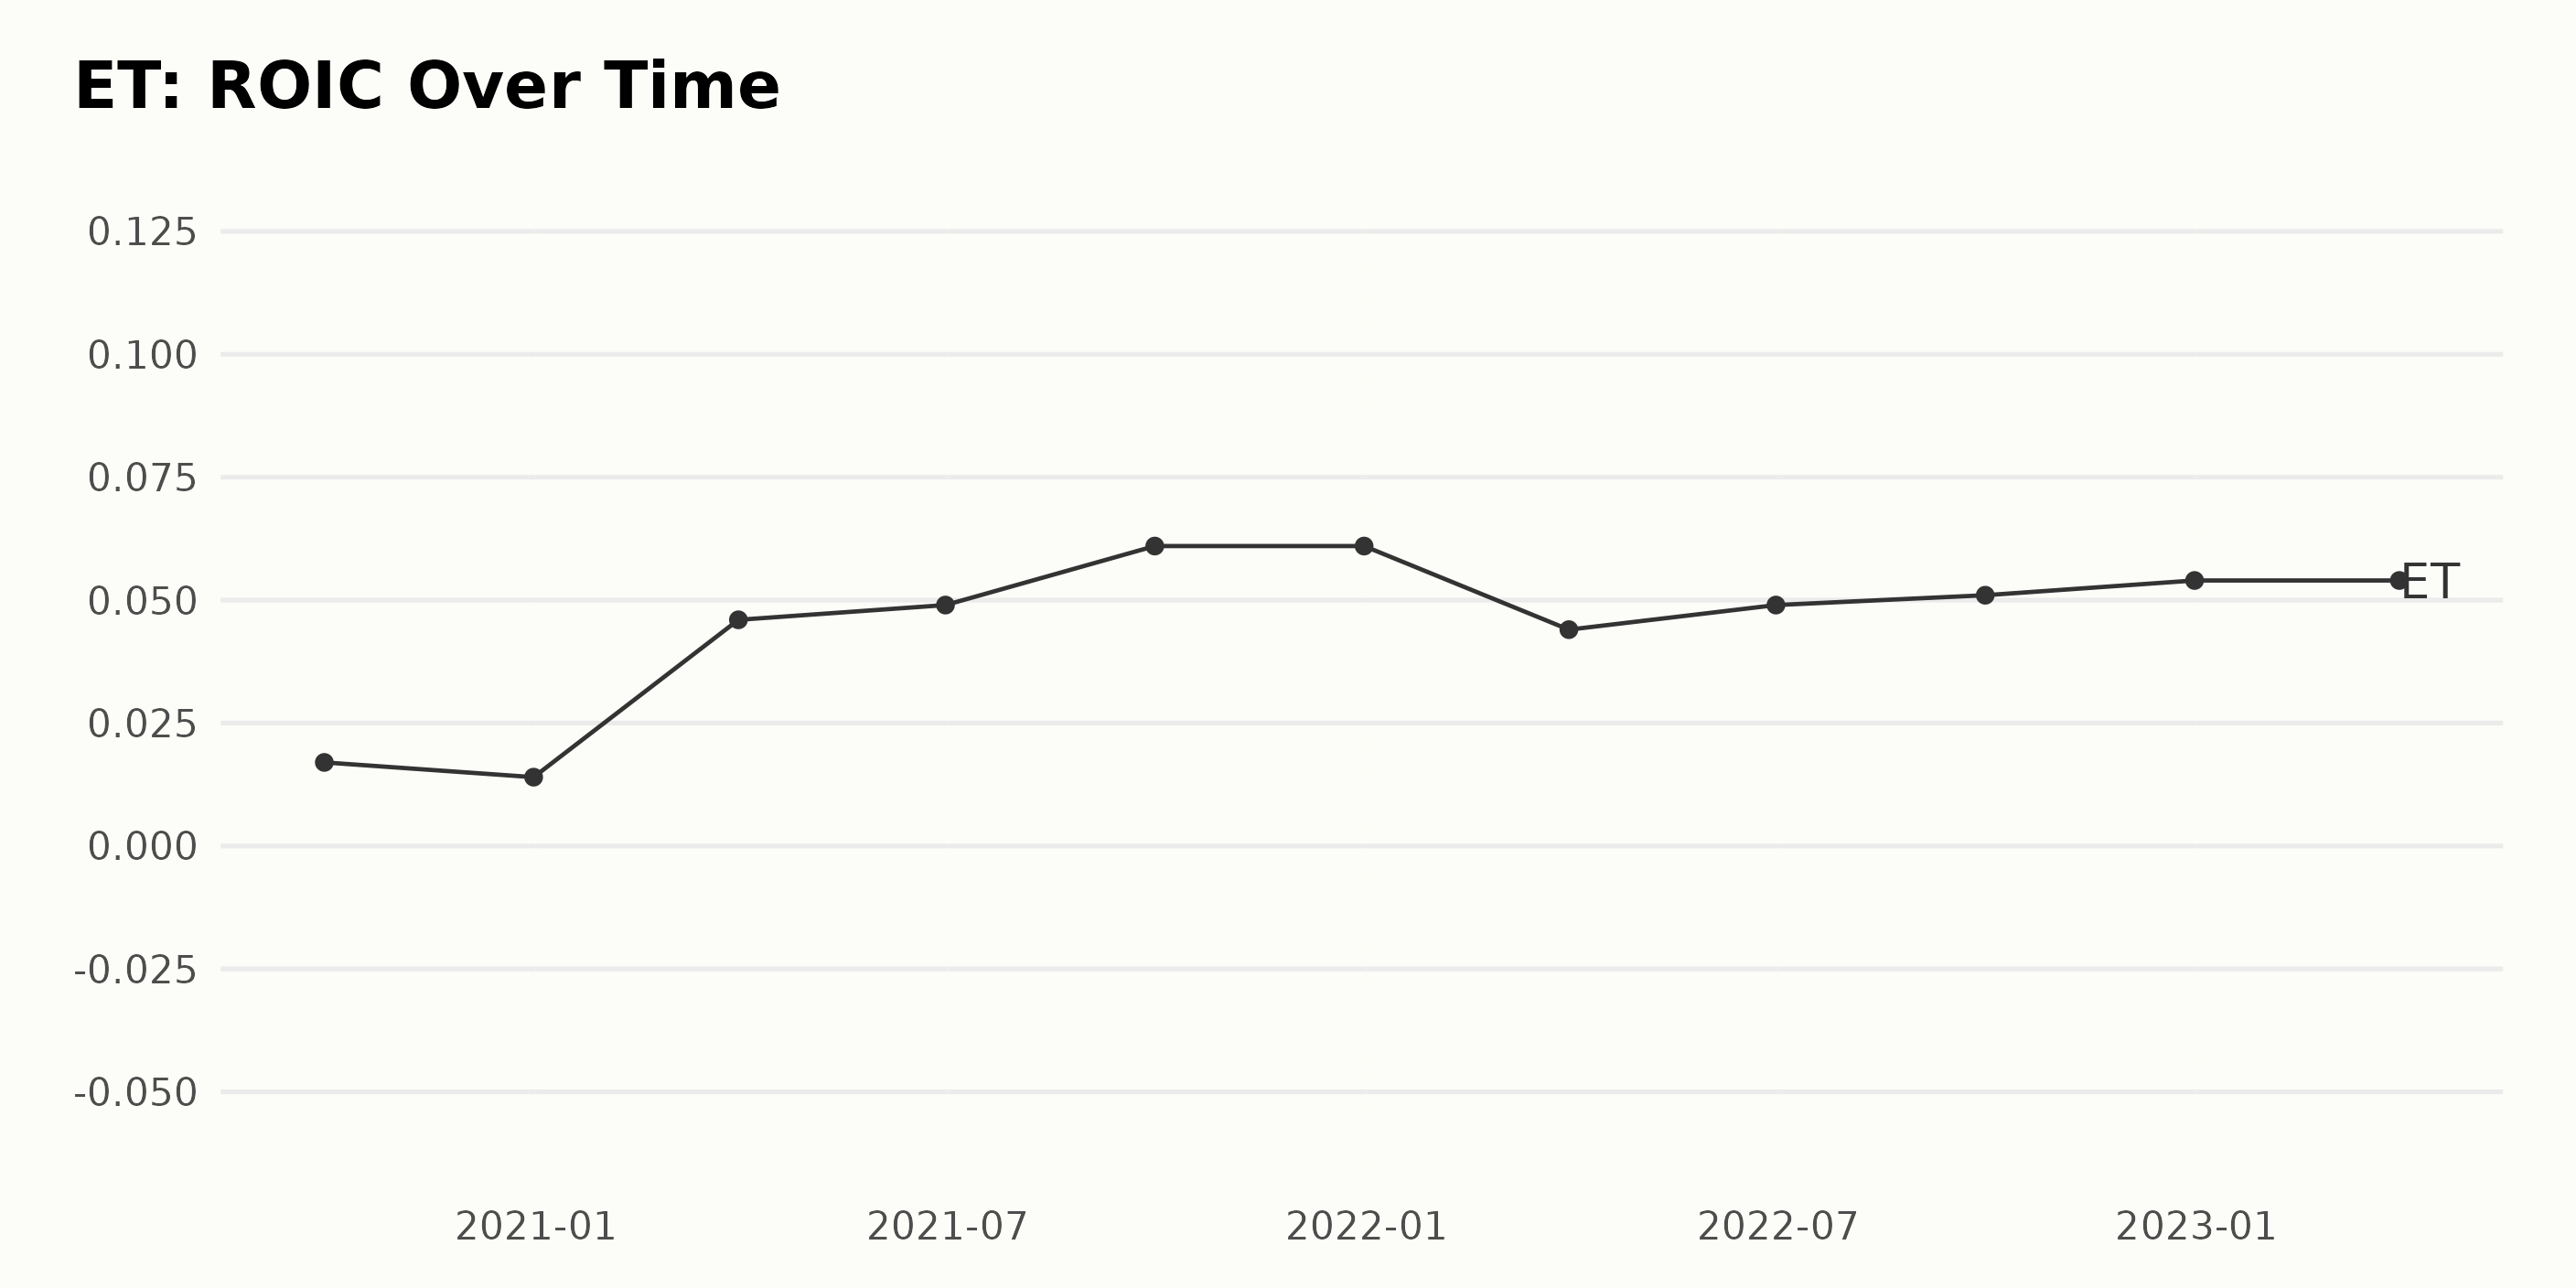
The ROIC of ET has shown an overall upward trend over the observed period, albeit with some fluctuations. Here are the highlights based on two significant figures:
- September 2020: The ROIC was 1.7%.
- December 2020: The ROIC dropped slightly to 1.4%.
- By March 2021, there was a substantial uplift in ROIC to 4.6%, which continued to increase slightly to 4.9% by June 2021.
- September 2021 through December 2021, it attained its highest value of 6.1% that year.
- During the first quarter of 2022, the ROIC dipped to 4.4% but proceeded to recover marginally in the subsequent quarters, reaching 4.9% in June 2022 and then 5.1% in September 2022.
- As the series concludes in March 2023, the ROIC remained stable at 5.4% from December 2022 onward.
In calculating growth from the first value (1.7% in September 2020) to the last value (5.4% in March 2023), the growth rate amounted to almost 318%. This indicates significant performance improvement in the ET’s Return on Invested Capital over the reviewed period.
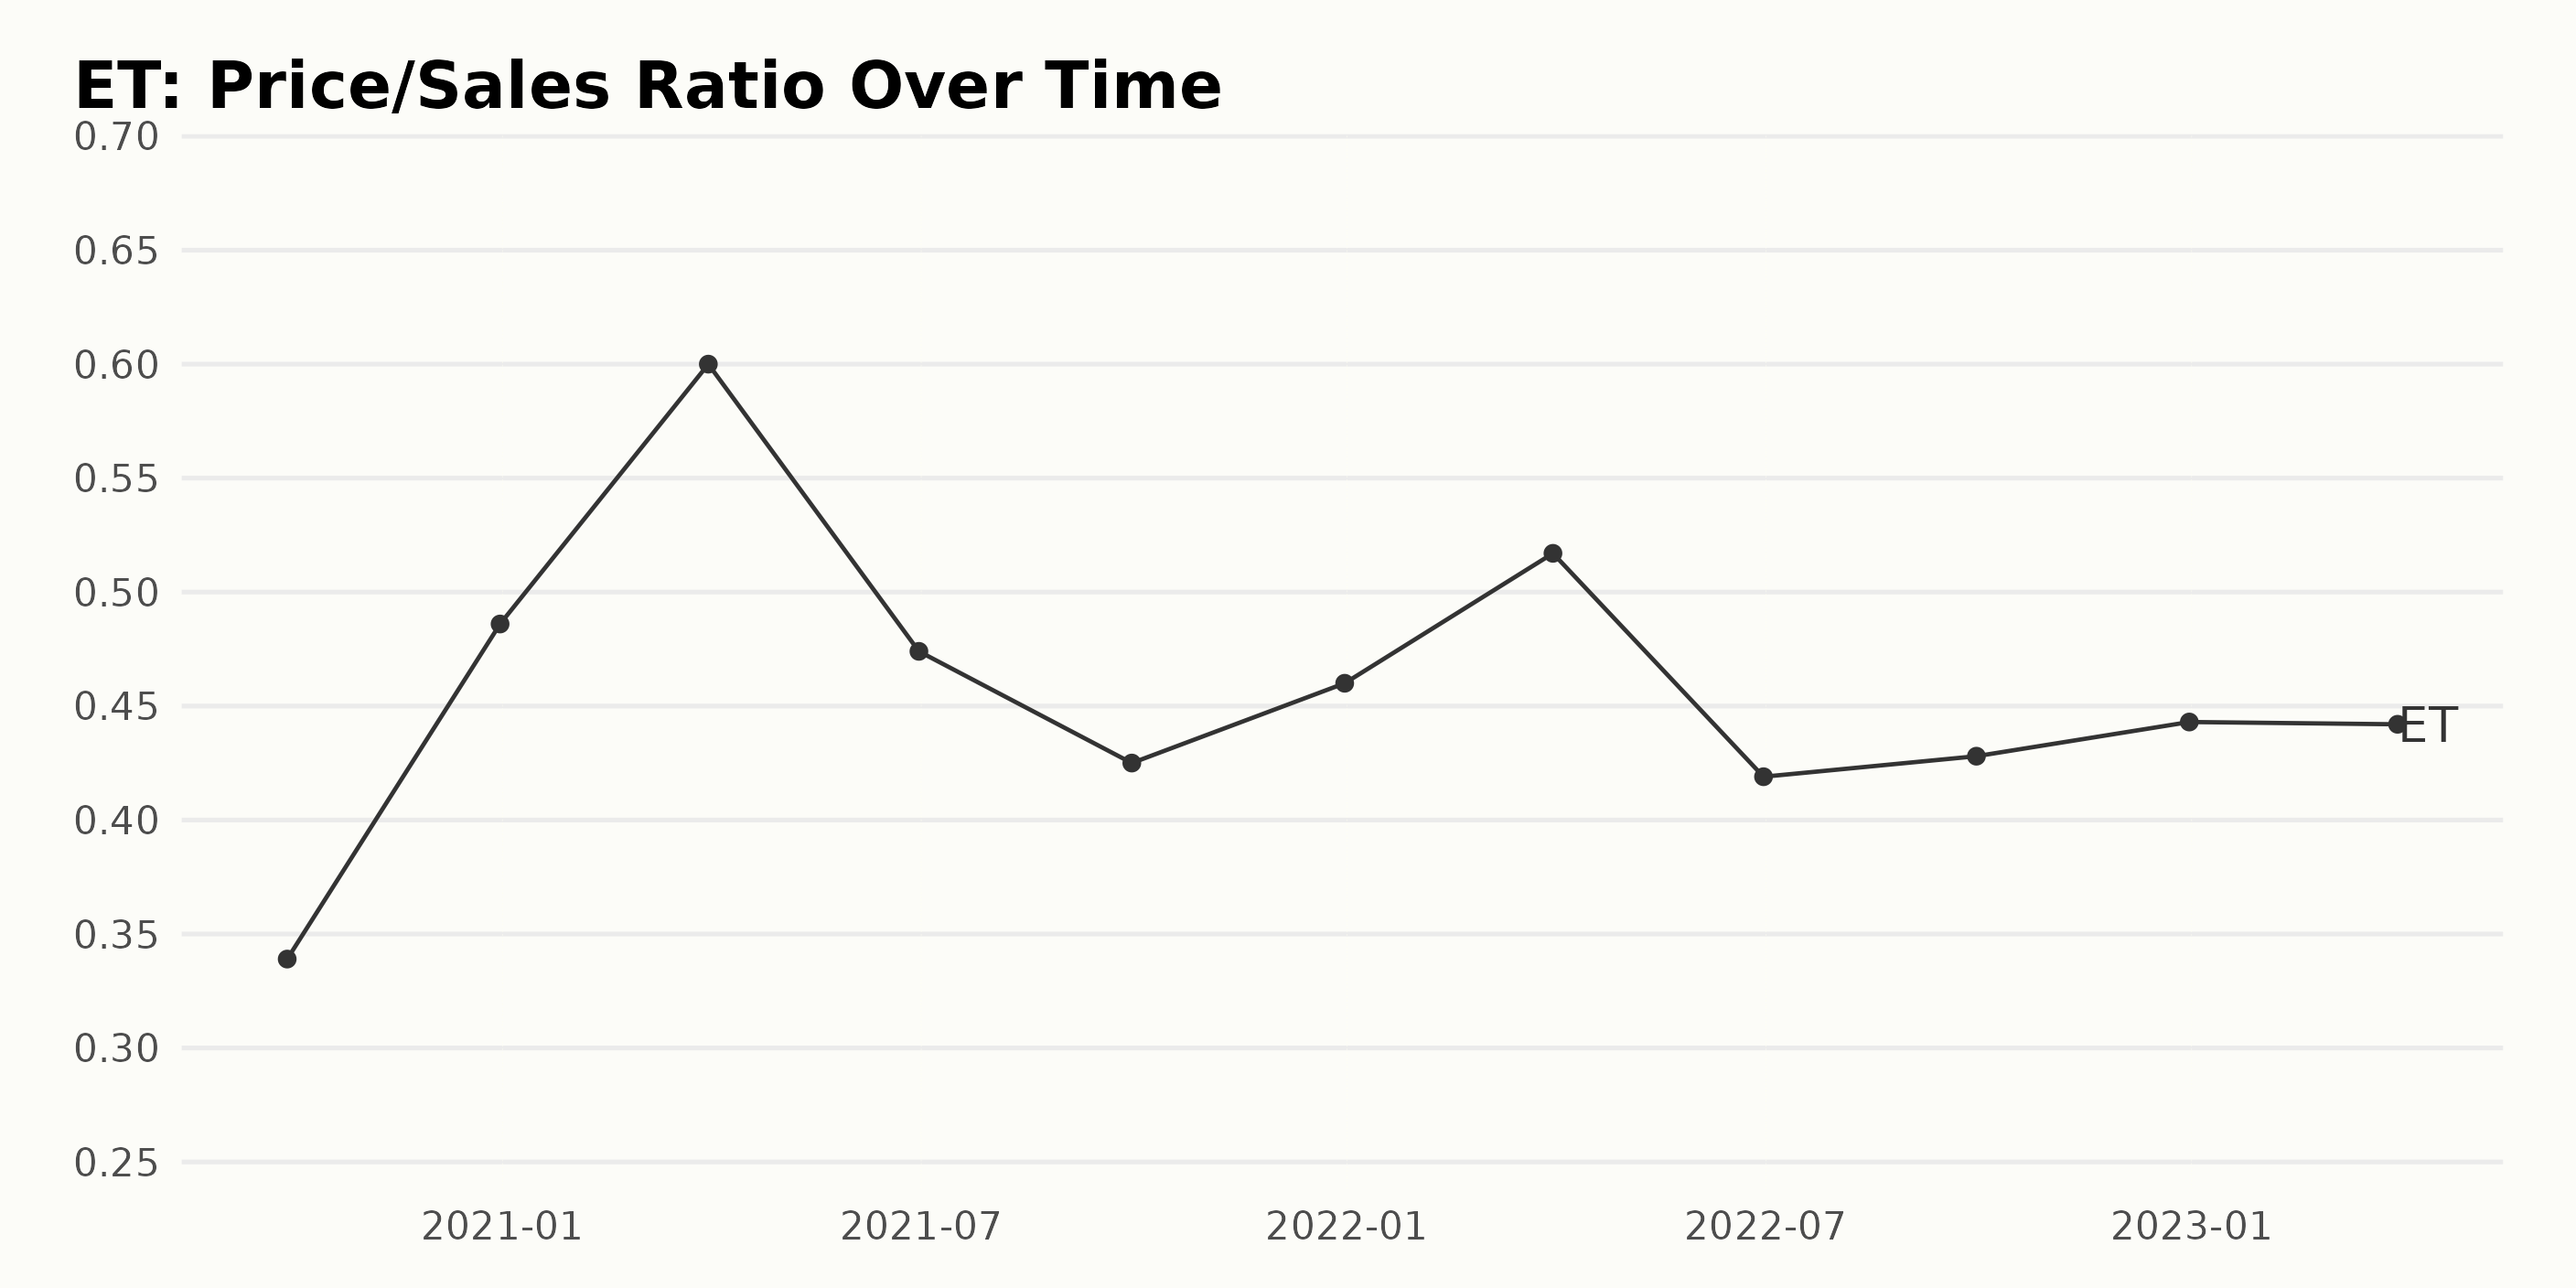
ET's Price/Sales Ratio (PS Ratio) shows some fluctuations from September 2020 to March 2023. Noteworthy points are as follows:
- The PS ratio of ET started at 0.34 in September 2020.
- It saw a significant increase, reaching 0.49 by the end of December 2020.
- This upward trend continued into 2021, with the PS Ratio peaking at 0.60 in March.
- However, the mid-2021 values declined, dropping to 0.47 in June and 0.43 by September.
- Despite a small rise to 0.46 in December 2021, the PS Ratio generally remained stable around 0.44-0.46 through 2022 and into the first quarter of 2023.
- The last recorded value in the data series is 0.44 as of March 2023.
In terms of growth rate, measured from the first to the last value, the PS Ratio of ET increased from 0.34 to 0.44 over the roughly two-and-a-half-year period. This represents a growth rate of approximately 29%.
Overall, the more recent trend in the data from 2021 onwards suggests some stabilization in ET’s PS Ratio after a notable upward shift in late 2020 and early 2021.
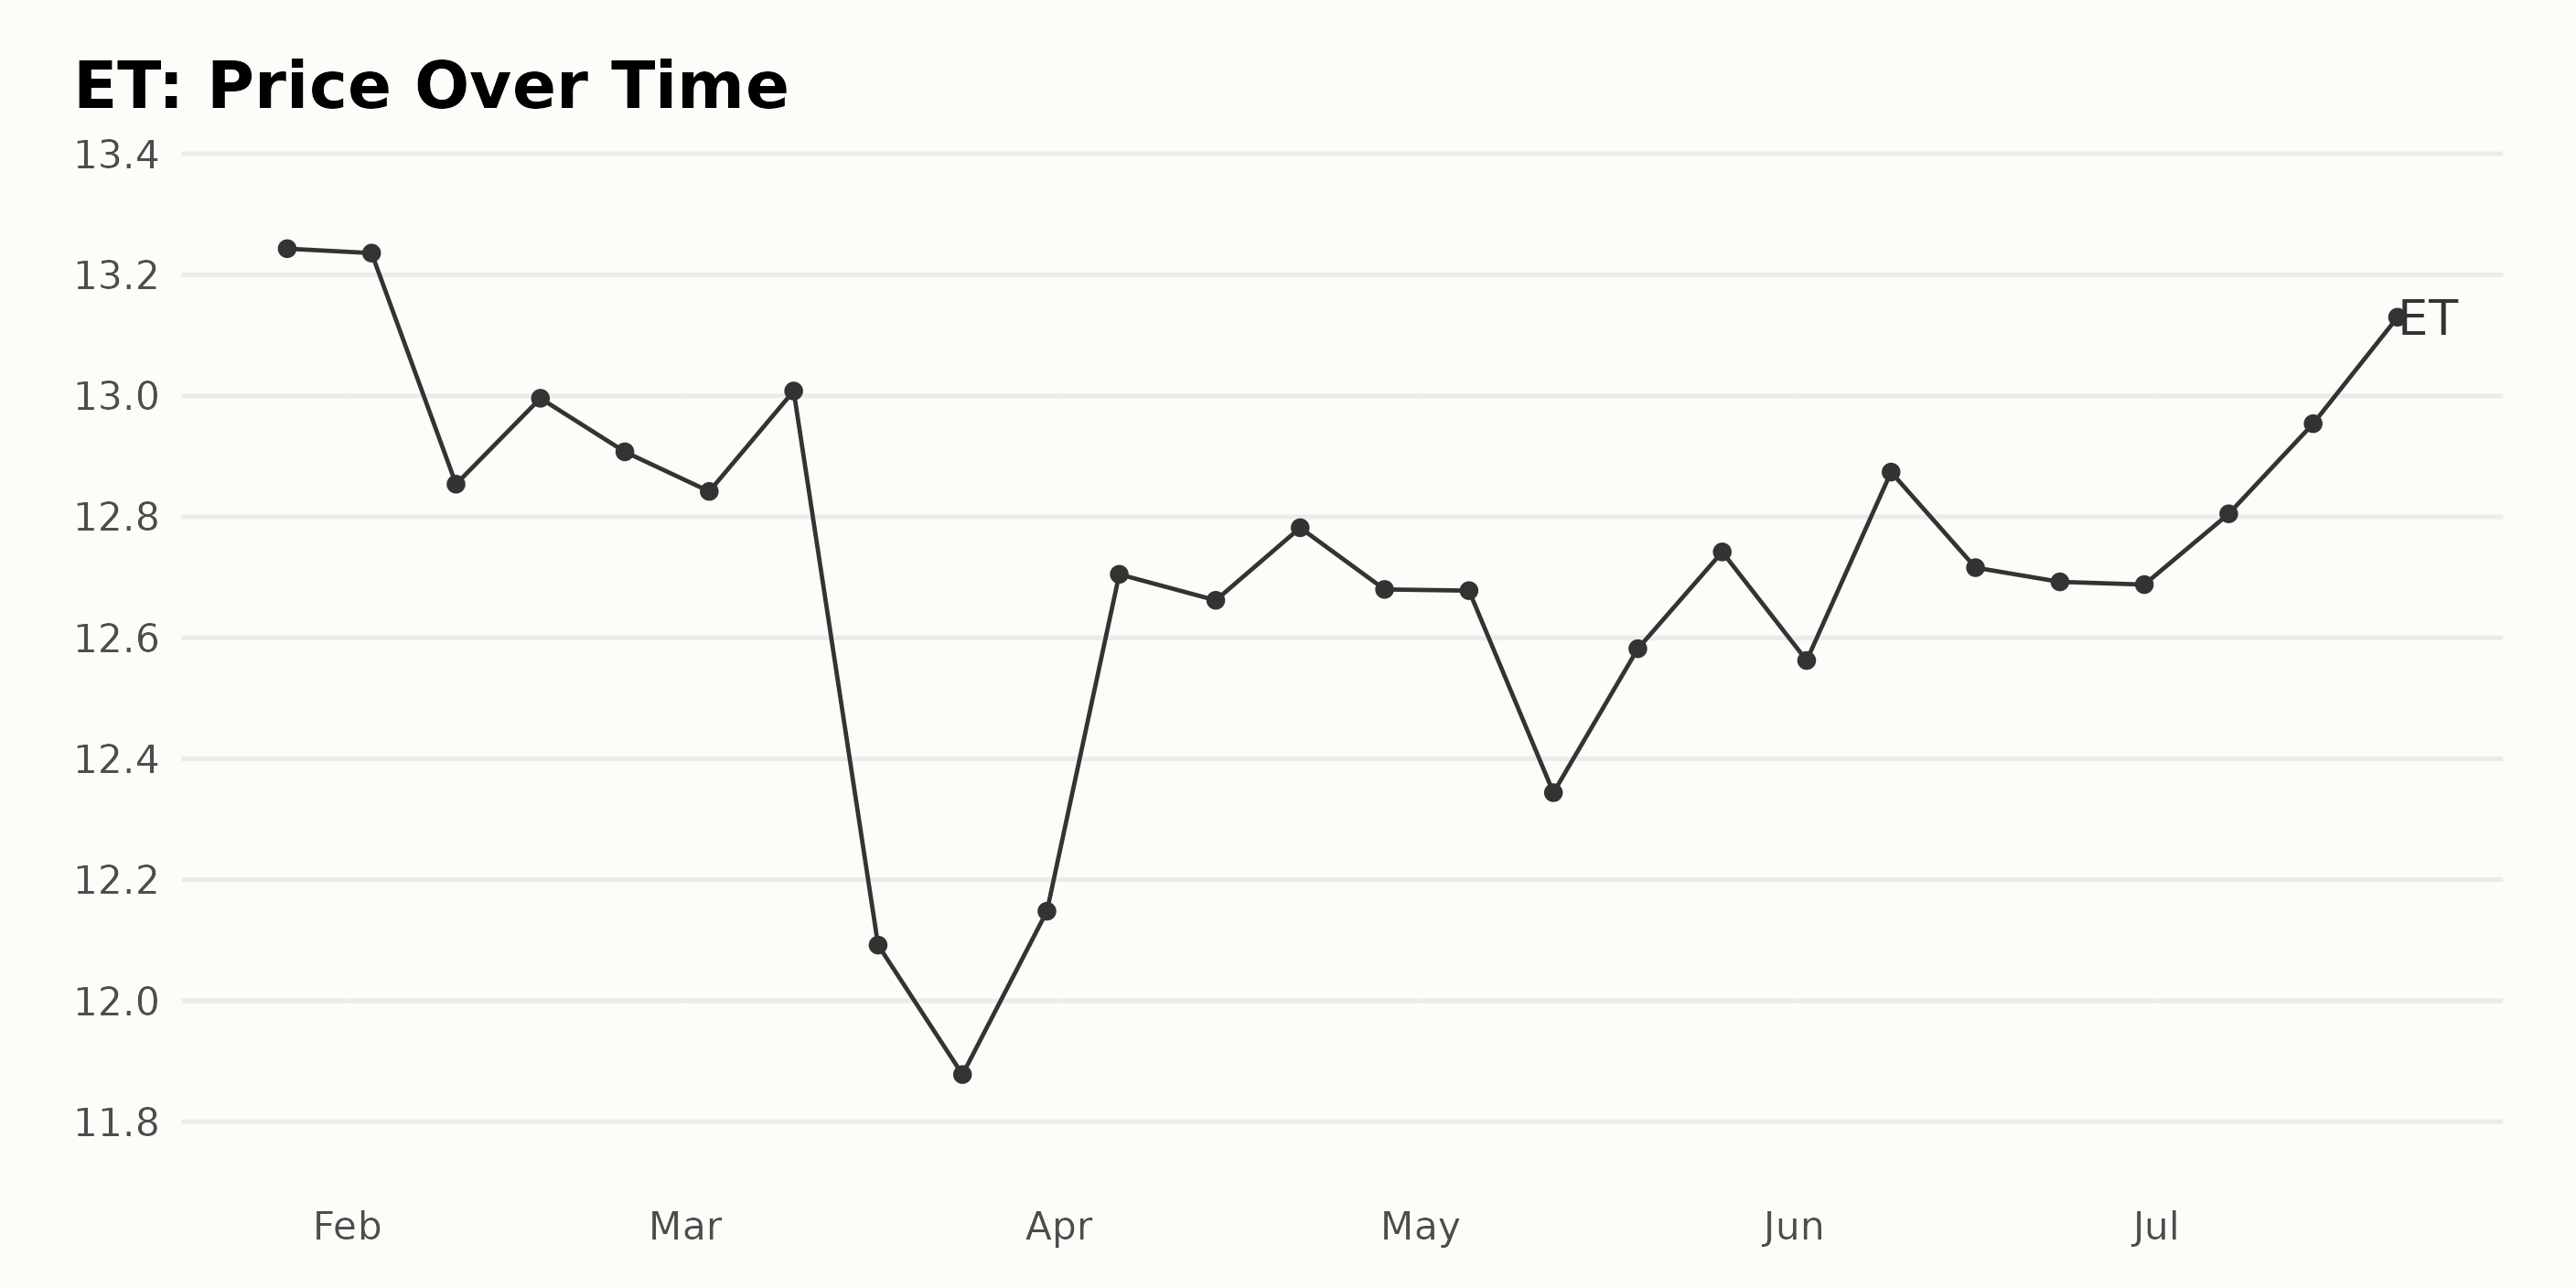
ET’s Price Analysis: A Closer Look at the Fluctuation Pattern in 2023
Looking at the data provided, here is an analysis of ET’s price trend and growth rate:
- On January 27, 2023, the asset started at $13.24.
- By February 3, 2023, there was a slight decline.
- A continuous decrease was noted in the third week of February, with the price dropping to $12.85 on February 10 and $12.99 on February 17. By the end of February, the price stood at $12.91.
- Moving into March, the price decreased further, reaching its lowest point at $11.88 on March 24, before experiencing a small increase at the end of the month, closing at $12.15.
- April saw a general increase in ET’s price, starting at $12.70 at the beginning of the month and closing at $12.68 at the end.
- In May, the price continued its slight oscillation, starting at $12.68 on May 5, decreasing to $12.34 in mid-May, but again rising and ending the month at $12.74.
- The prices in June moderately fluctuated between $12.56 and $12.87, finally settling down at $12.69 by the end of the month.
- A steady increase can be noticed in July, with the price starting at $12.81 and reaching a high of $13.15 by July 21. This marks the highest point in the data set since the start of the year.
On observing the trend, ET generally fluctuated around $13, dipping a few times but not significantly deviating. There is no clear pattern of acceleration or deceleration in price changes. Here is a chart of ET’s price over the past 180 days.
Understanding ET’s Momentum, Value, and Stability Trends: January-July 2023 Insights
ET has an overall B rating, translating to a Buy in our POWR Ratings system. It is ranked #11 out of the 89 stocks in the Energy - Oil & Gas category.
This ranking suggests a robust performance relative to the other stocks in the same category. Let’s delve into some notable dates for specifics:
- In January 2023, ET started with a POWR grade of C and ranked 38.
- It maintained a grade C till early March, for about two months, albeit with slight fluctuations in the rank within the category.
- A promotion to grade B occurred in the week of March 4, 2023, indicative of an improvement in ET’s prospects within its investment strategy.
- ET retained the B grade intermittently until July, witnessing betterment in its rank to an impressive single-digit value from May onwards - with its best rank being 5 in the first week of July, indicating superior performance.
In summary, ET’s general trajectory throughout the first half of 2023 was marked by sustained improvement, reflected by its enhanced POWR grade and better ranking within its category.
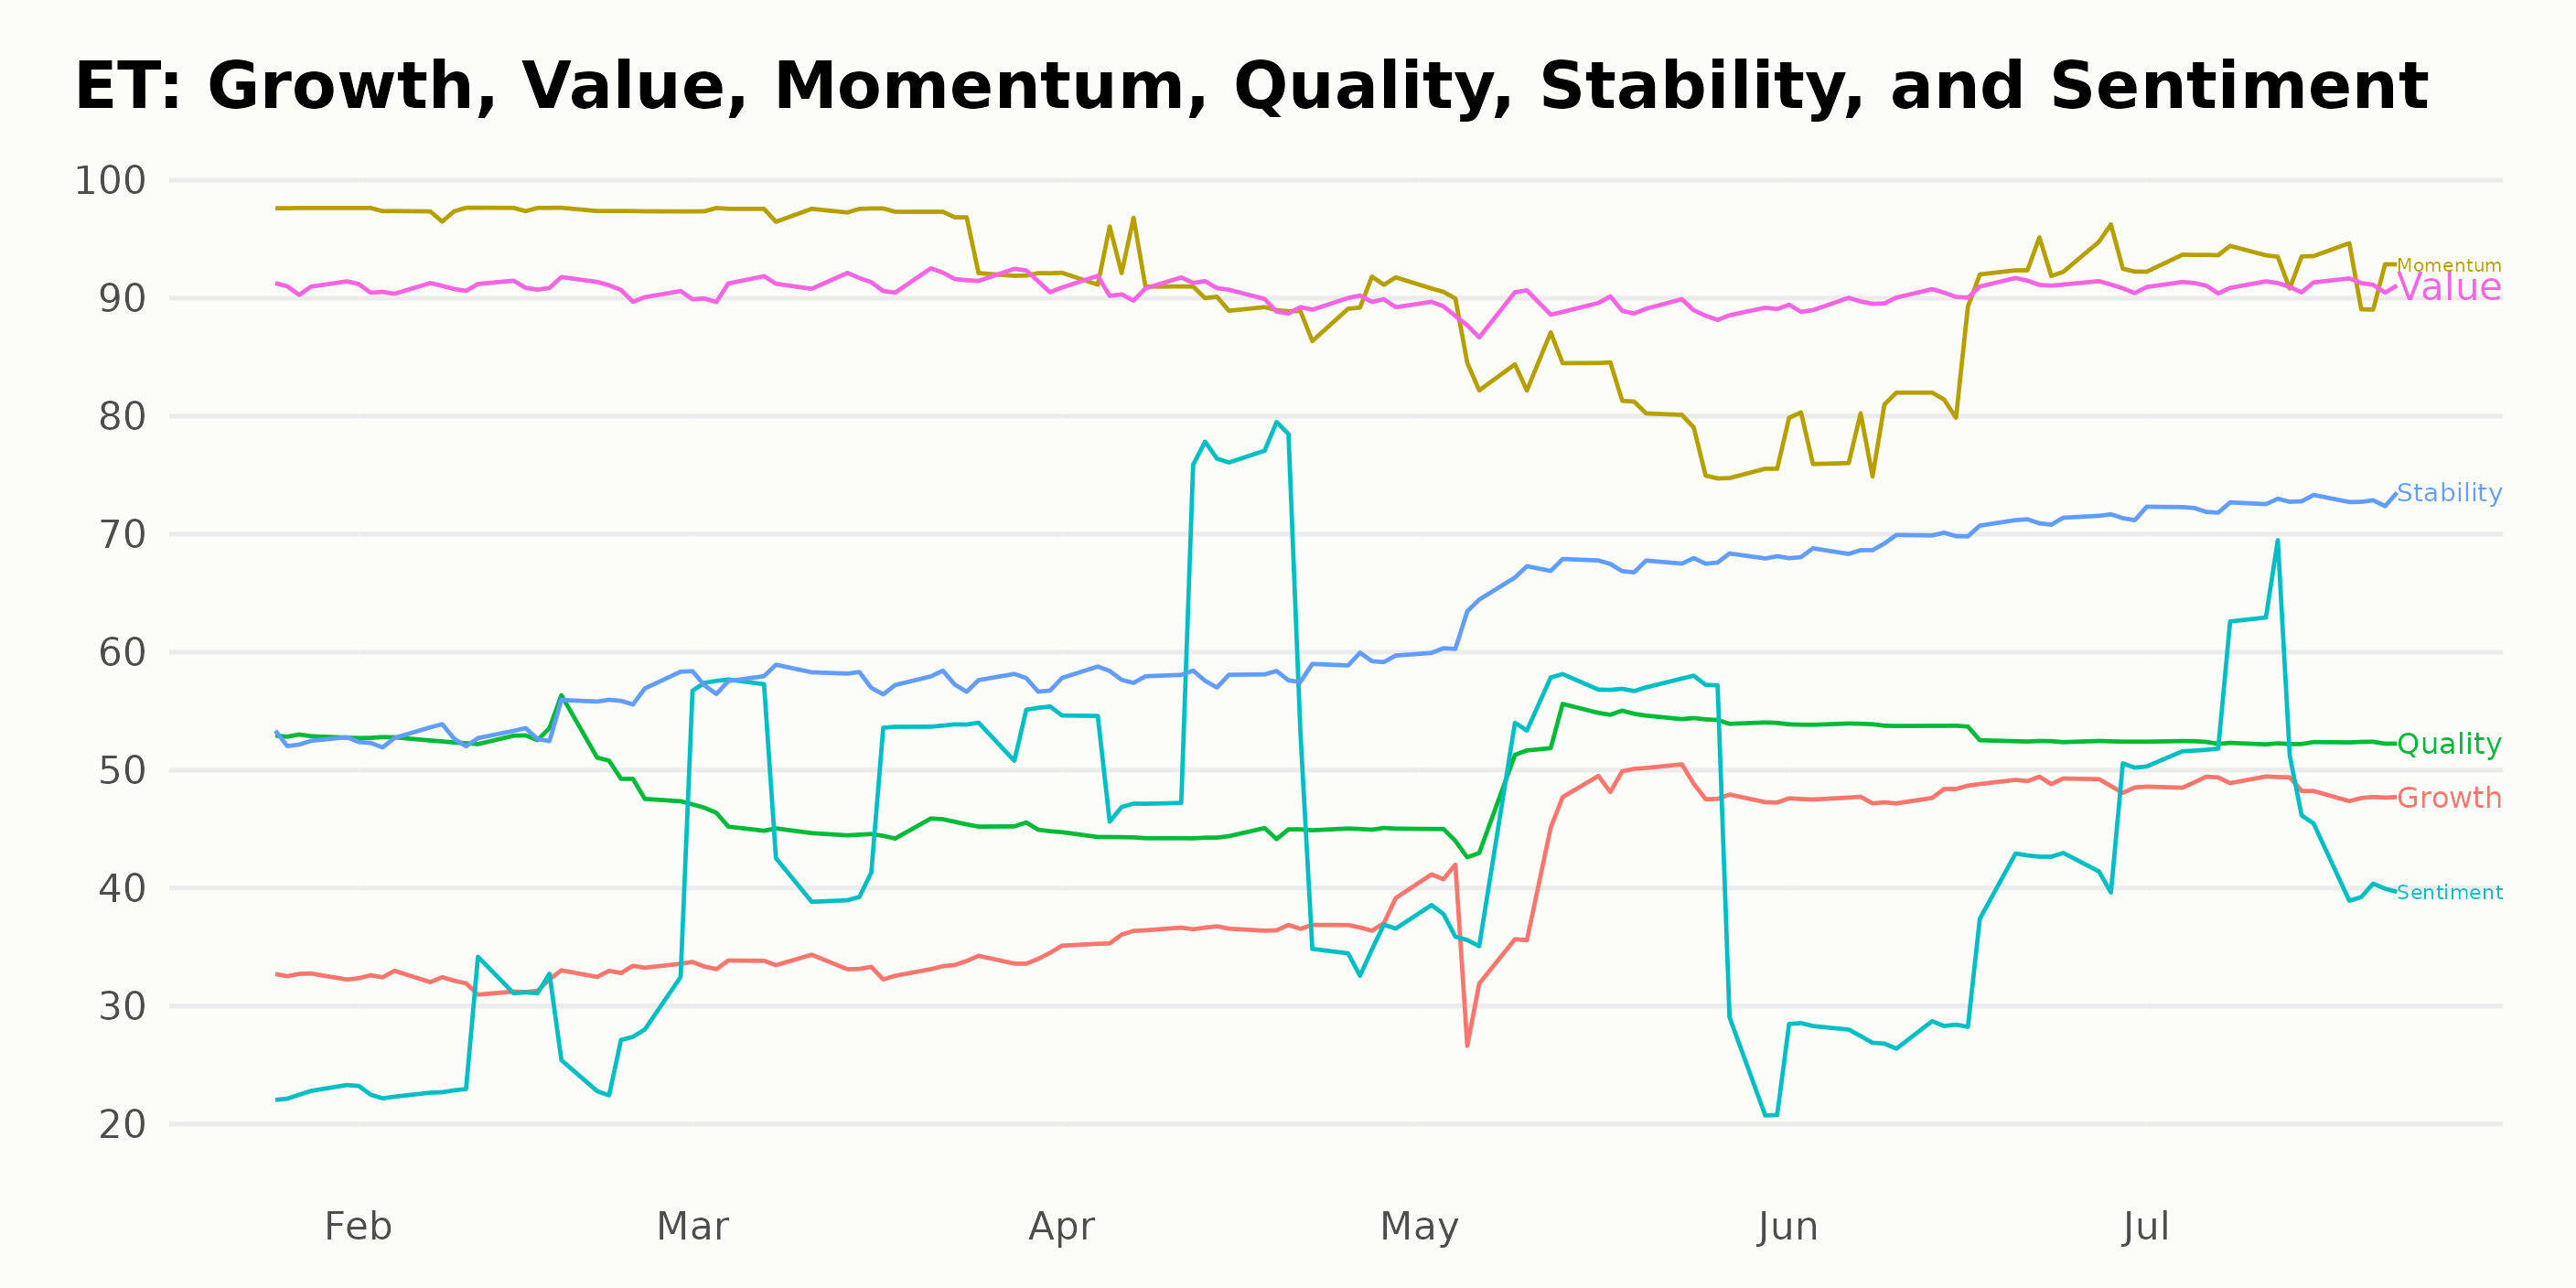
According to the POWR Ratings for ET, the three most noteworthy dimensions are Momentum, Value, and Stability due to their consistently high ratings. Detailed below are the observations made from January 2023 to July 2023.
Momentum: The momentum dimension for ET held significantly high throughout the timeframe.
- In January 2023, it stood at a high of 98.
- This figure marginally decreased to 97 in February 2023, descended to 96 in March, and dropped to 91 by April 2023.
- By May, the momentum had reduced to 82 but rose slightly to 86 in June before climbing back to 93 by July 2023.
Value: The value dimension has also consistently shown high ratings with minor fluctuations.
- The Value score was 91 in January 2023.
- It maintained this rating in February and March as well.
- A slight dip to 90 was observed in April, which then declined further to 89 in May 2023.
- Nevertheless, it recovered in June, reaching 90 and 91 by July 2023.
Stability: The stability dimension clearly increased over the observed months.
- Stability started at 53 in January 2023.
- Although there was a slight increase to 54 in February, the escalation became more noticeable from March onwards.
- By March, the score had risen to 58.
- The score steadily increased in the following months, reaching 66 in May, 70 in June, and 73 by July 2023.
These trends and values show Momentum, Value, and Stability as the most significant dimensions for ET within the context of the POWR Ratings.
How does Energy Transfer LP (ET) Stack Up Against its Peers?
Other stocks in the Energy - Oil & Gas sector that may be worth considering are Valero Energy Corp. (VLO), Cheniere Energy Inc. (LNG), and Weatherford International PLC (WFRD) -- they have better POWR Ratings.
What To Do Next?
Get your hands on this special report with 3 low priced companies with tremendous upside potential even in today’s volatile markets:
3 Stocks to DOUBLE This Year >
ET shares were trading at $13.23 per share on Monday afternoon, up $0.08 (+0.61%). Year-to-date, ET has gained 16.93%, versus a 19.72% rise in the benchmark S&P 500 index during the same period.
About the Author: Subhasree Kar

Subhasree’s keen interest in financial instruments led her to pursue a career as an investment analyst. After earning a Master’s degree in Economics, she gained knowledge of equity research and portfolio management at Finlatics.
The post Does Energy Transfer LP (ET) Offer Both Value and Momentum? appeared first on StockNews.com