
Anheuser-Busch InBev SA/NV (BUD) has established itself as a dominant player in the worldwide brewing industry, recognized for being among the largest corporations within the industry. The company boasts of an illustrious portfolio of brands featuring acclaimed names such as Stella Artois, Beck’s, and Budweiser.
Recent volatility in the company’s stock prices can be primarily attributed to a marketing campaign launched in March when its most recent influencer collaboration incited a diverse mix of praise and criticism.
Despite these transient challenges, Morgan Stanley revised BUD’s rating from Equal-Weight to Overweight on July 20, 2023. This shift suggests that the financial institution has adopted a more optimistic view of the stock’s prospects, anticipating that it could outpace market performance in the immediate future.
Furthermore, BUD’s forward P/B and non-GAAP PEG ratios of 1.53 and 1.86 are 46.3% and 28.1% lower than the respective industry averages of 2.84 and 2.59.
Additionally, beverage firms are widely understood as ‘recession-resistant,’ benefiting from the steadfast demand for alcoholic and non-alcoholic beverages.
With an eye towards shifting consumer preferences, beverage companies have been incorporating sustainable and healthier choices into their product range, propelling significant growth within the functional beverages sector—especially in emerging markets.
Data sourced from Statista anticipates revenue in the beverage sector to hit $64.38 billion this year and is further expected to expand at a CAGR of 15.% until 2027.
Moreover, driven by innovation and new product launches, the beverage industry is predicted to witness substantial expansion in the long haul. Thus, BUD could serve as an attractive investment opportunity.
Let’s discuss some key metrics to understand the situation.
BUD’s Financial Performance: Analyzing Revenue, P/E Ratio, Current Ratio, and Analyst Price Target:
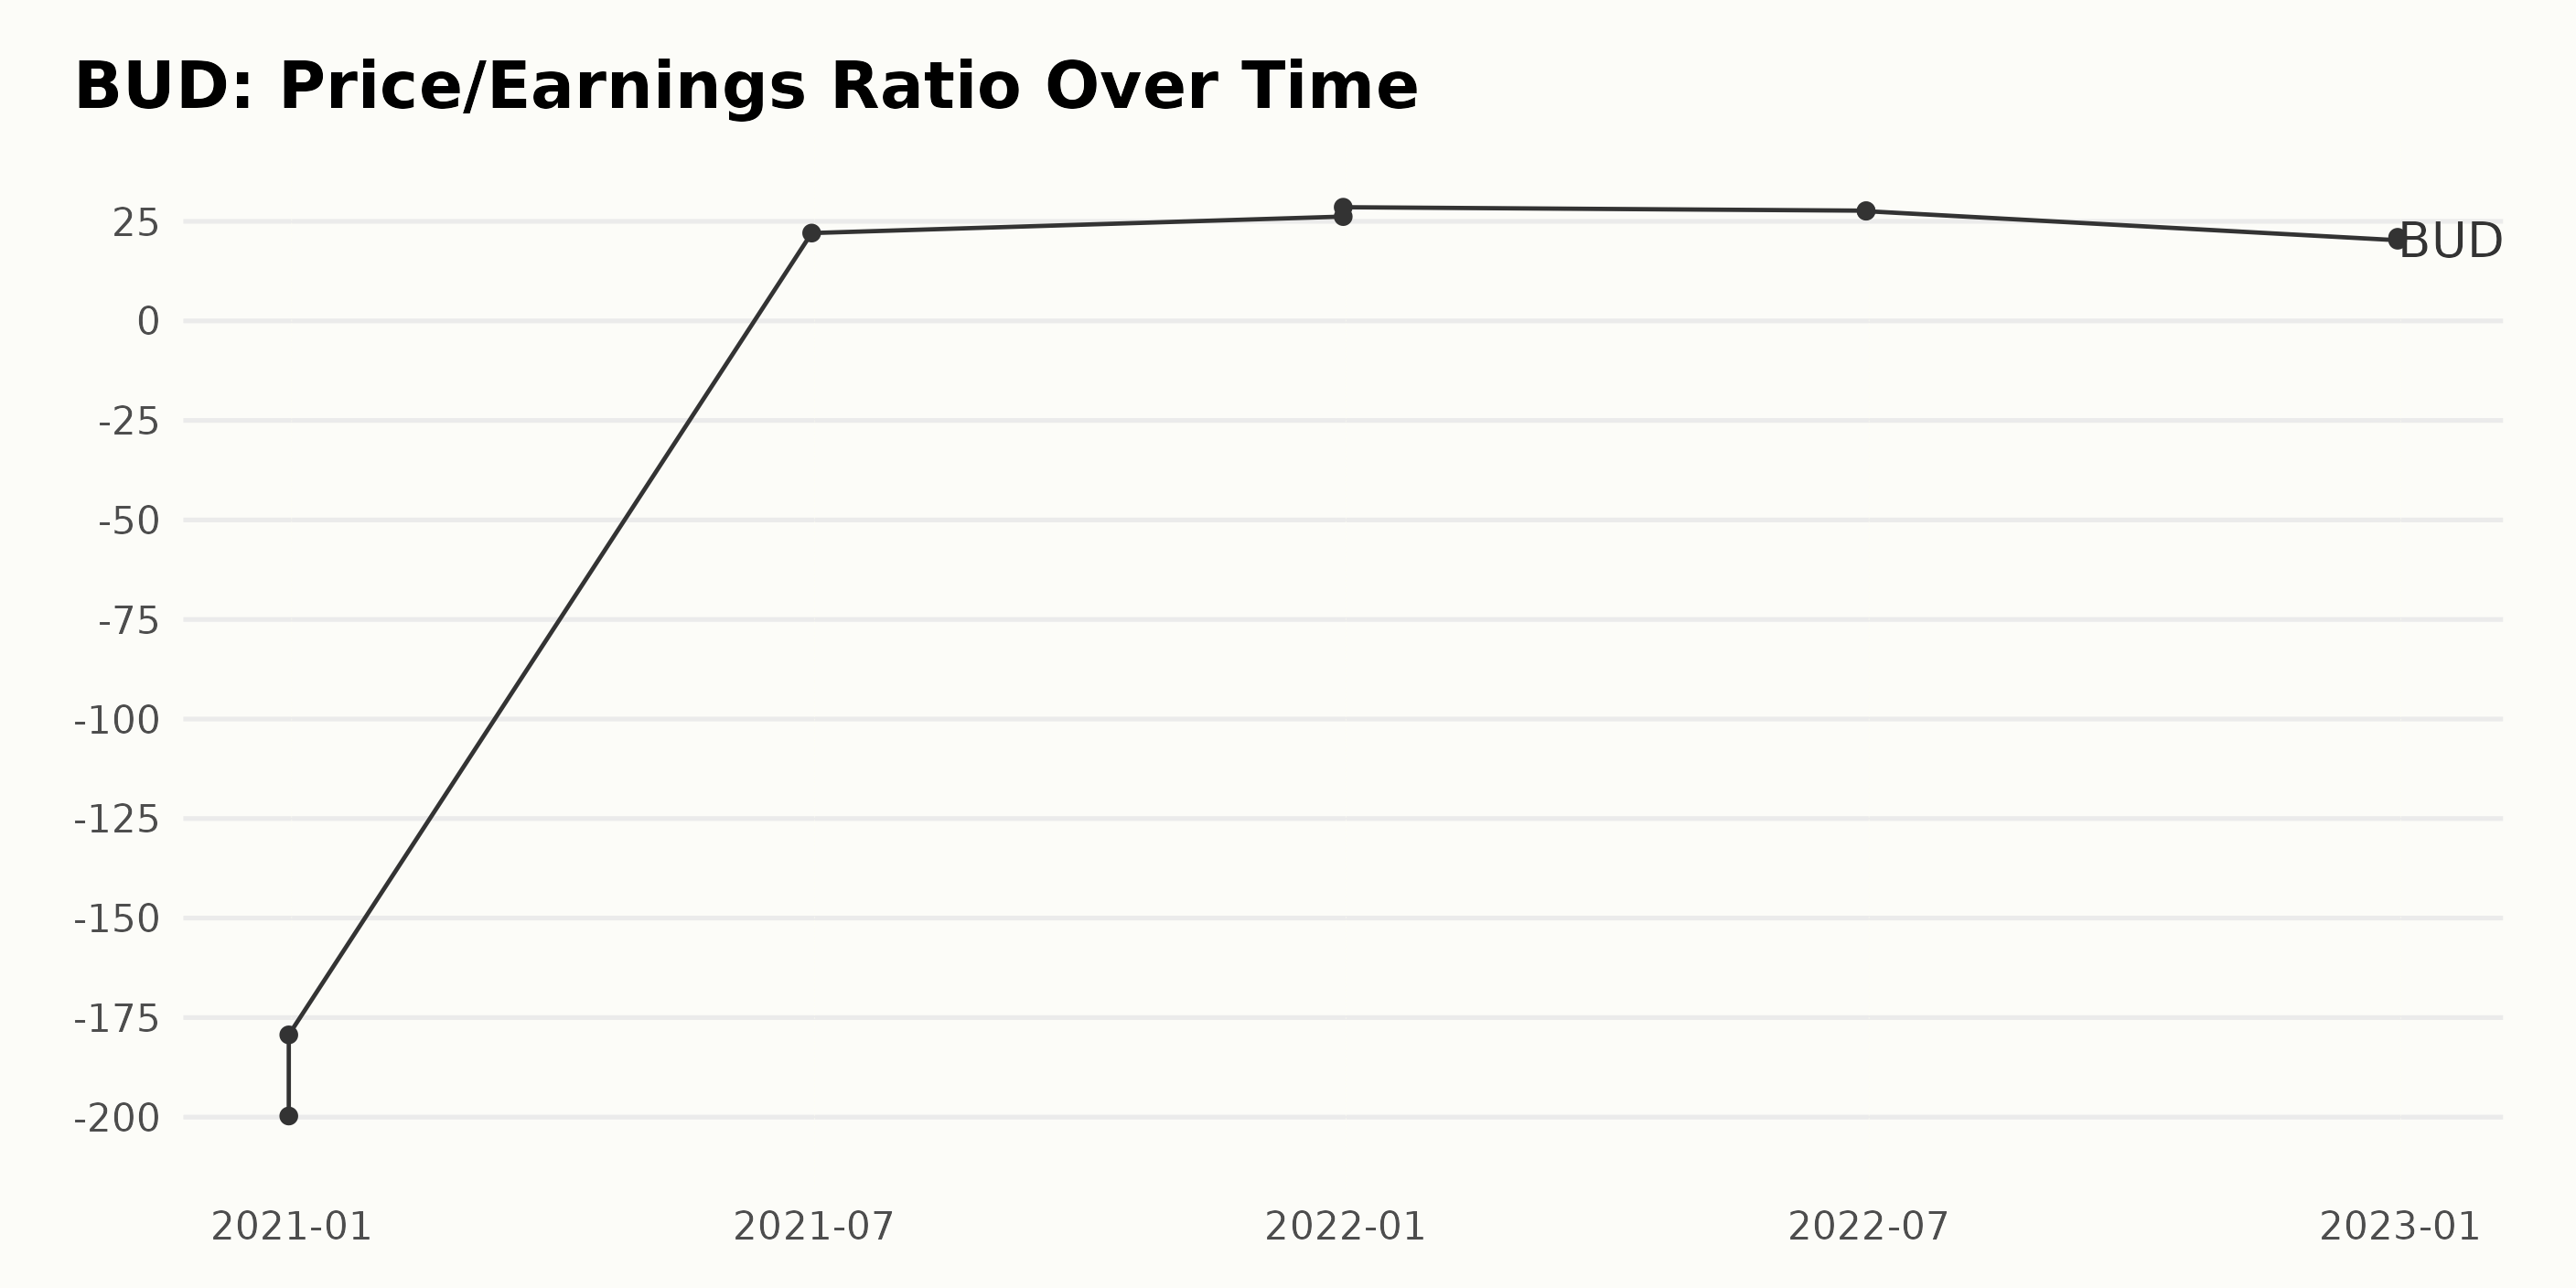
The series outline the fluctuation of BUD’S Price/Earnings Ratio (P/E) from December 2020 to December 2022. Analyzing this data suggests a prominent upward trend in the company’s P/E values, despite experiencing several fluctuations.
- At the start of the series, on December 31, 2020, the P/E was recorded at an extraordinarily negative value of -199.719, later somewhat improving to -179.34 on the same day.
- However, by June 30, 2021, there was a significant increase resulting in a positive P/E value of 22.067.
- This trend continued towards the end of 2021 with P/E closing at 28.558 on December 31, 2021.
- In mid-2022, slight variations were reported on June 30, with values of 27.691 and shortly after 27.567.
- Despite the general upward trend, the pe underwent a modest decline towards the end of 2022, closing at 21.001 on December 31, of that year.
The growth rate from December 31, 2020, to December 31, 2022, can be estimated by comparing the initial and final P/E values. The pe saw an increase from -199.719 to 21.001 during this period, signifying a noteworthy turnaround for BUD.
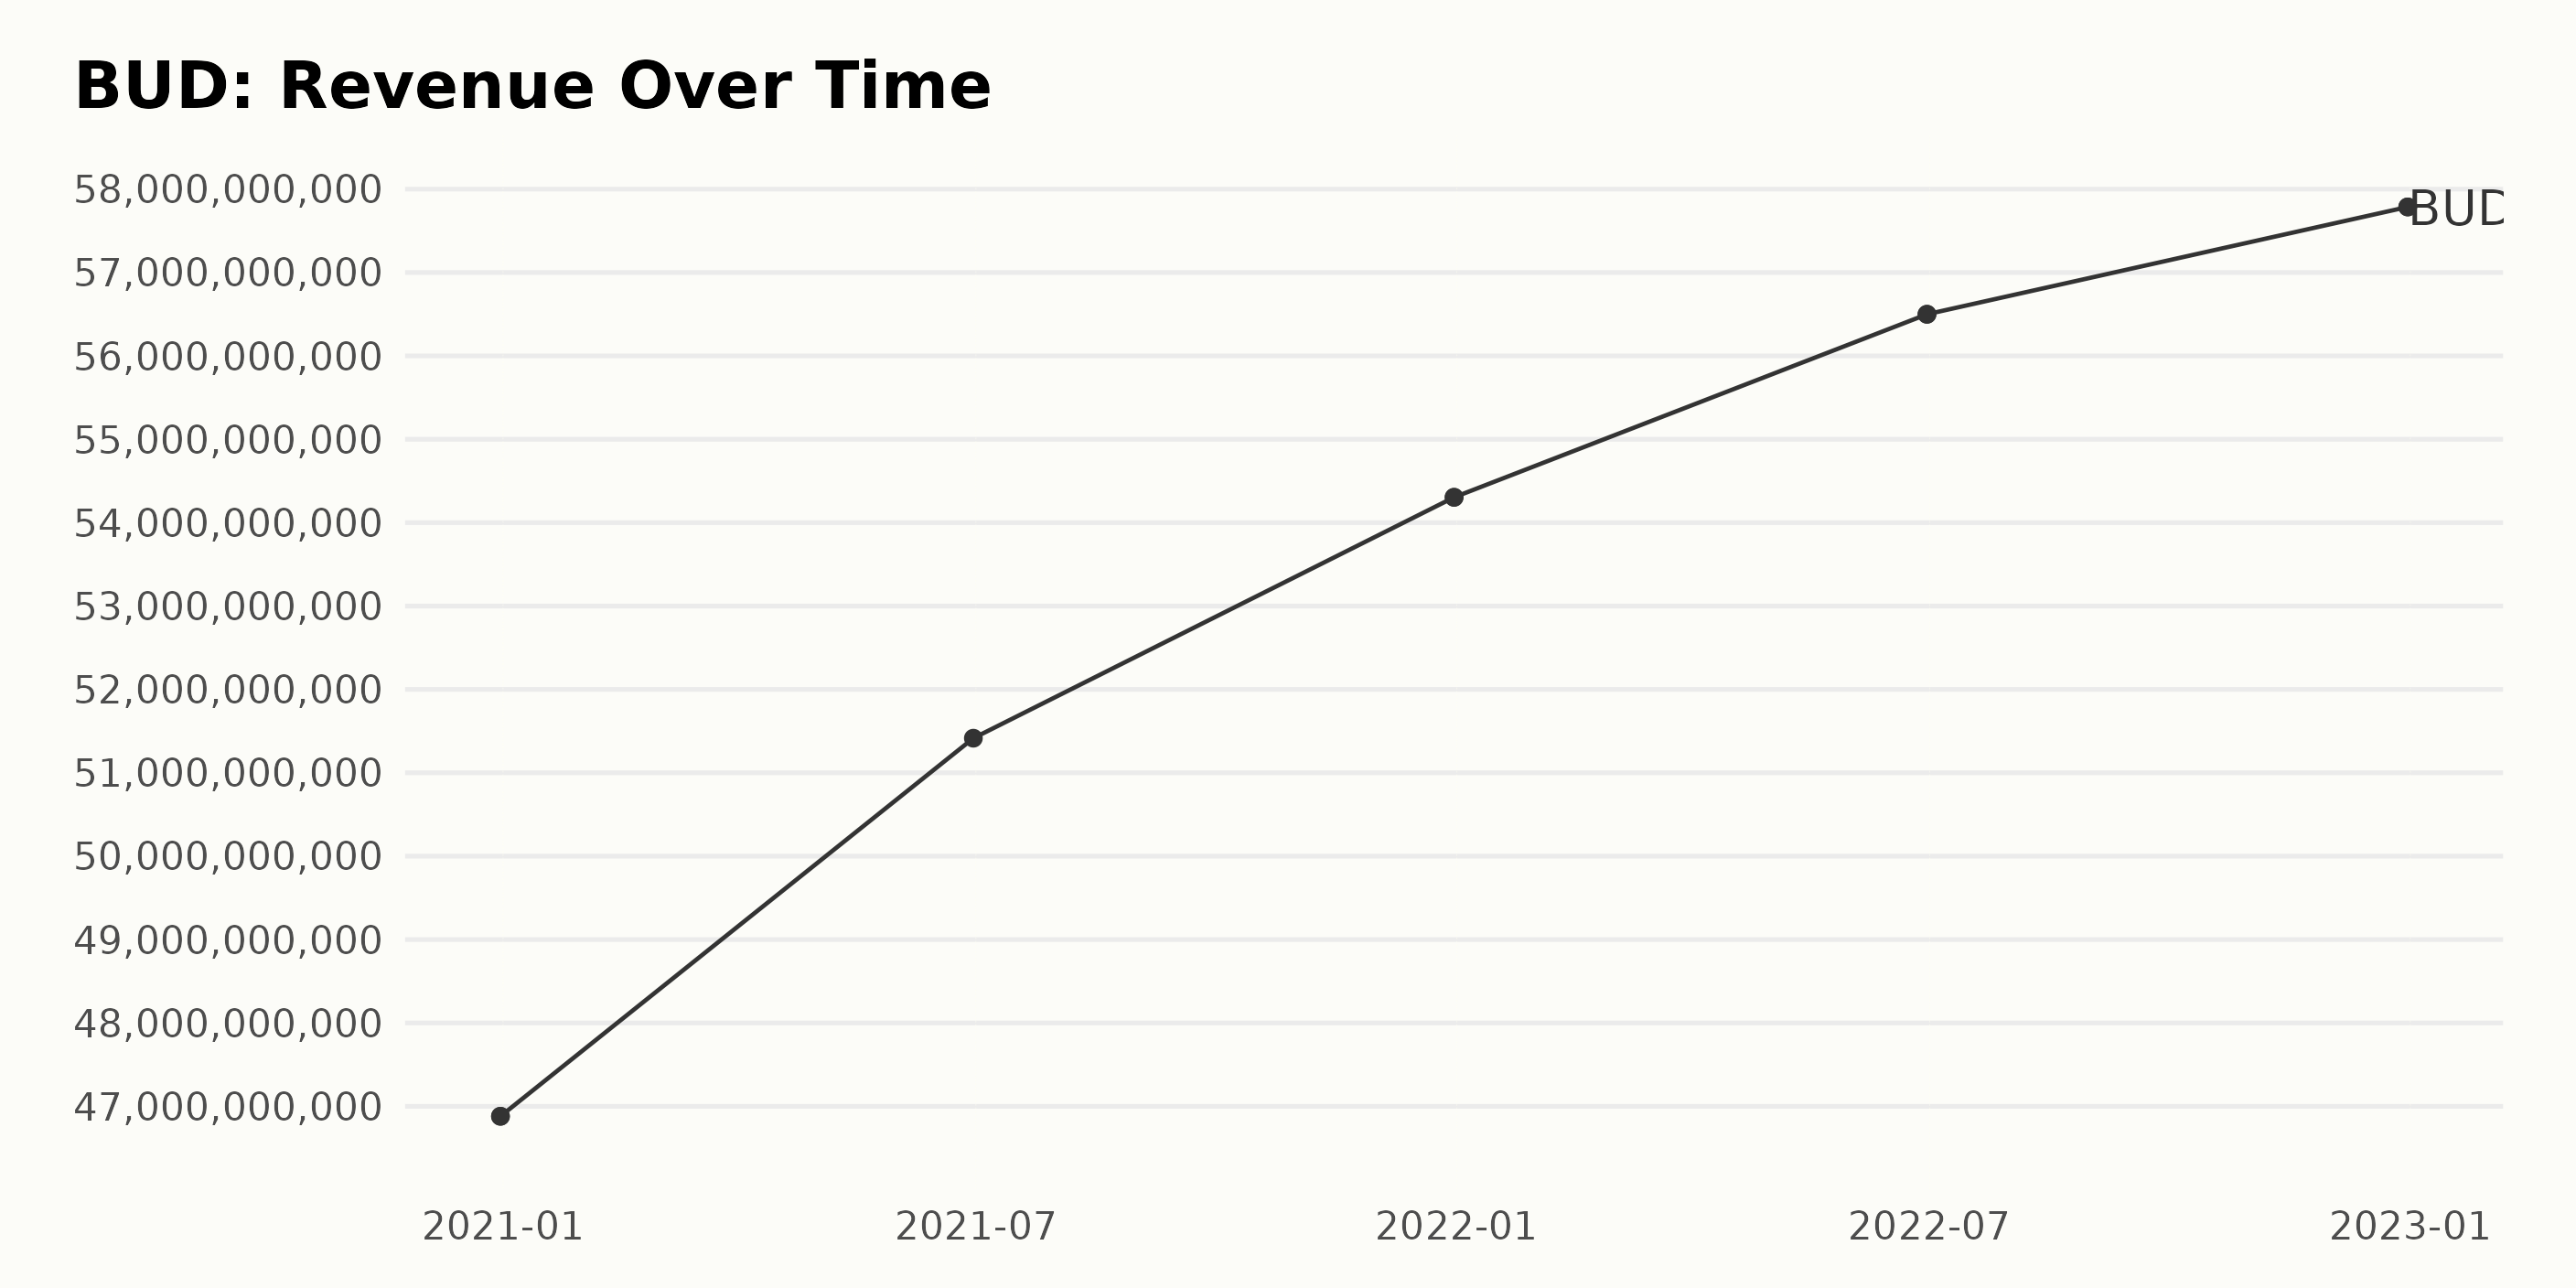
The series of data reports BUD’s trailing-12-month revenue over the past two years. Here is the summary of the fluctuations in BUD’s revenue:
- December 2020: BUD’s revenue was $46.88 billion
- June 2021: Revenue rose to $51.42 billion
- December 2021: Revenue further increased to $54.30 billion
- June 2022: Revenue peaked to $56.50 billion
- December 2022: Revenue hit a high of $57.79 billion, completing a total growth of 23.26%
These figures suggest a positive trend for BUD, with steady revenue growth over the two-year period.
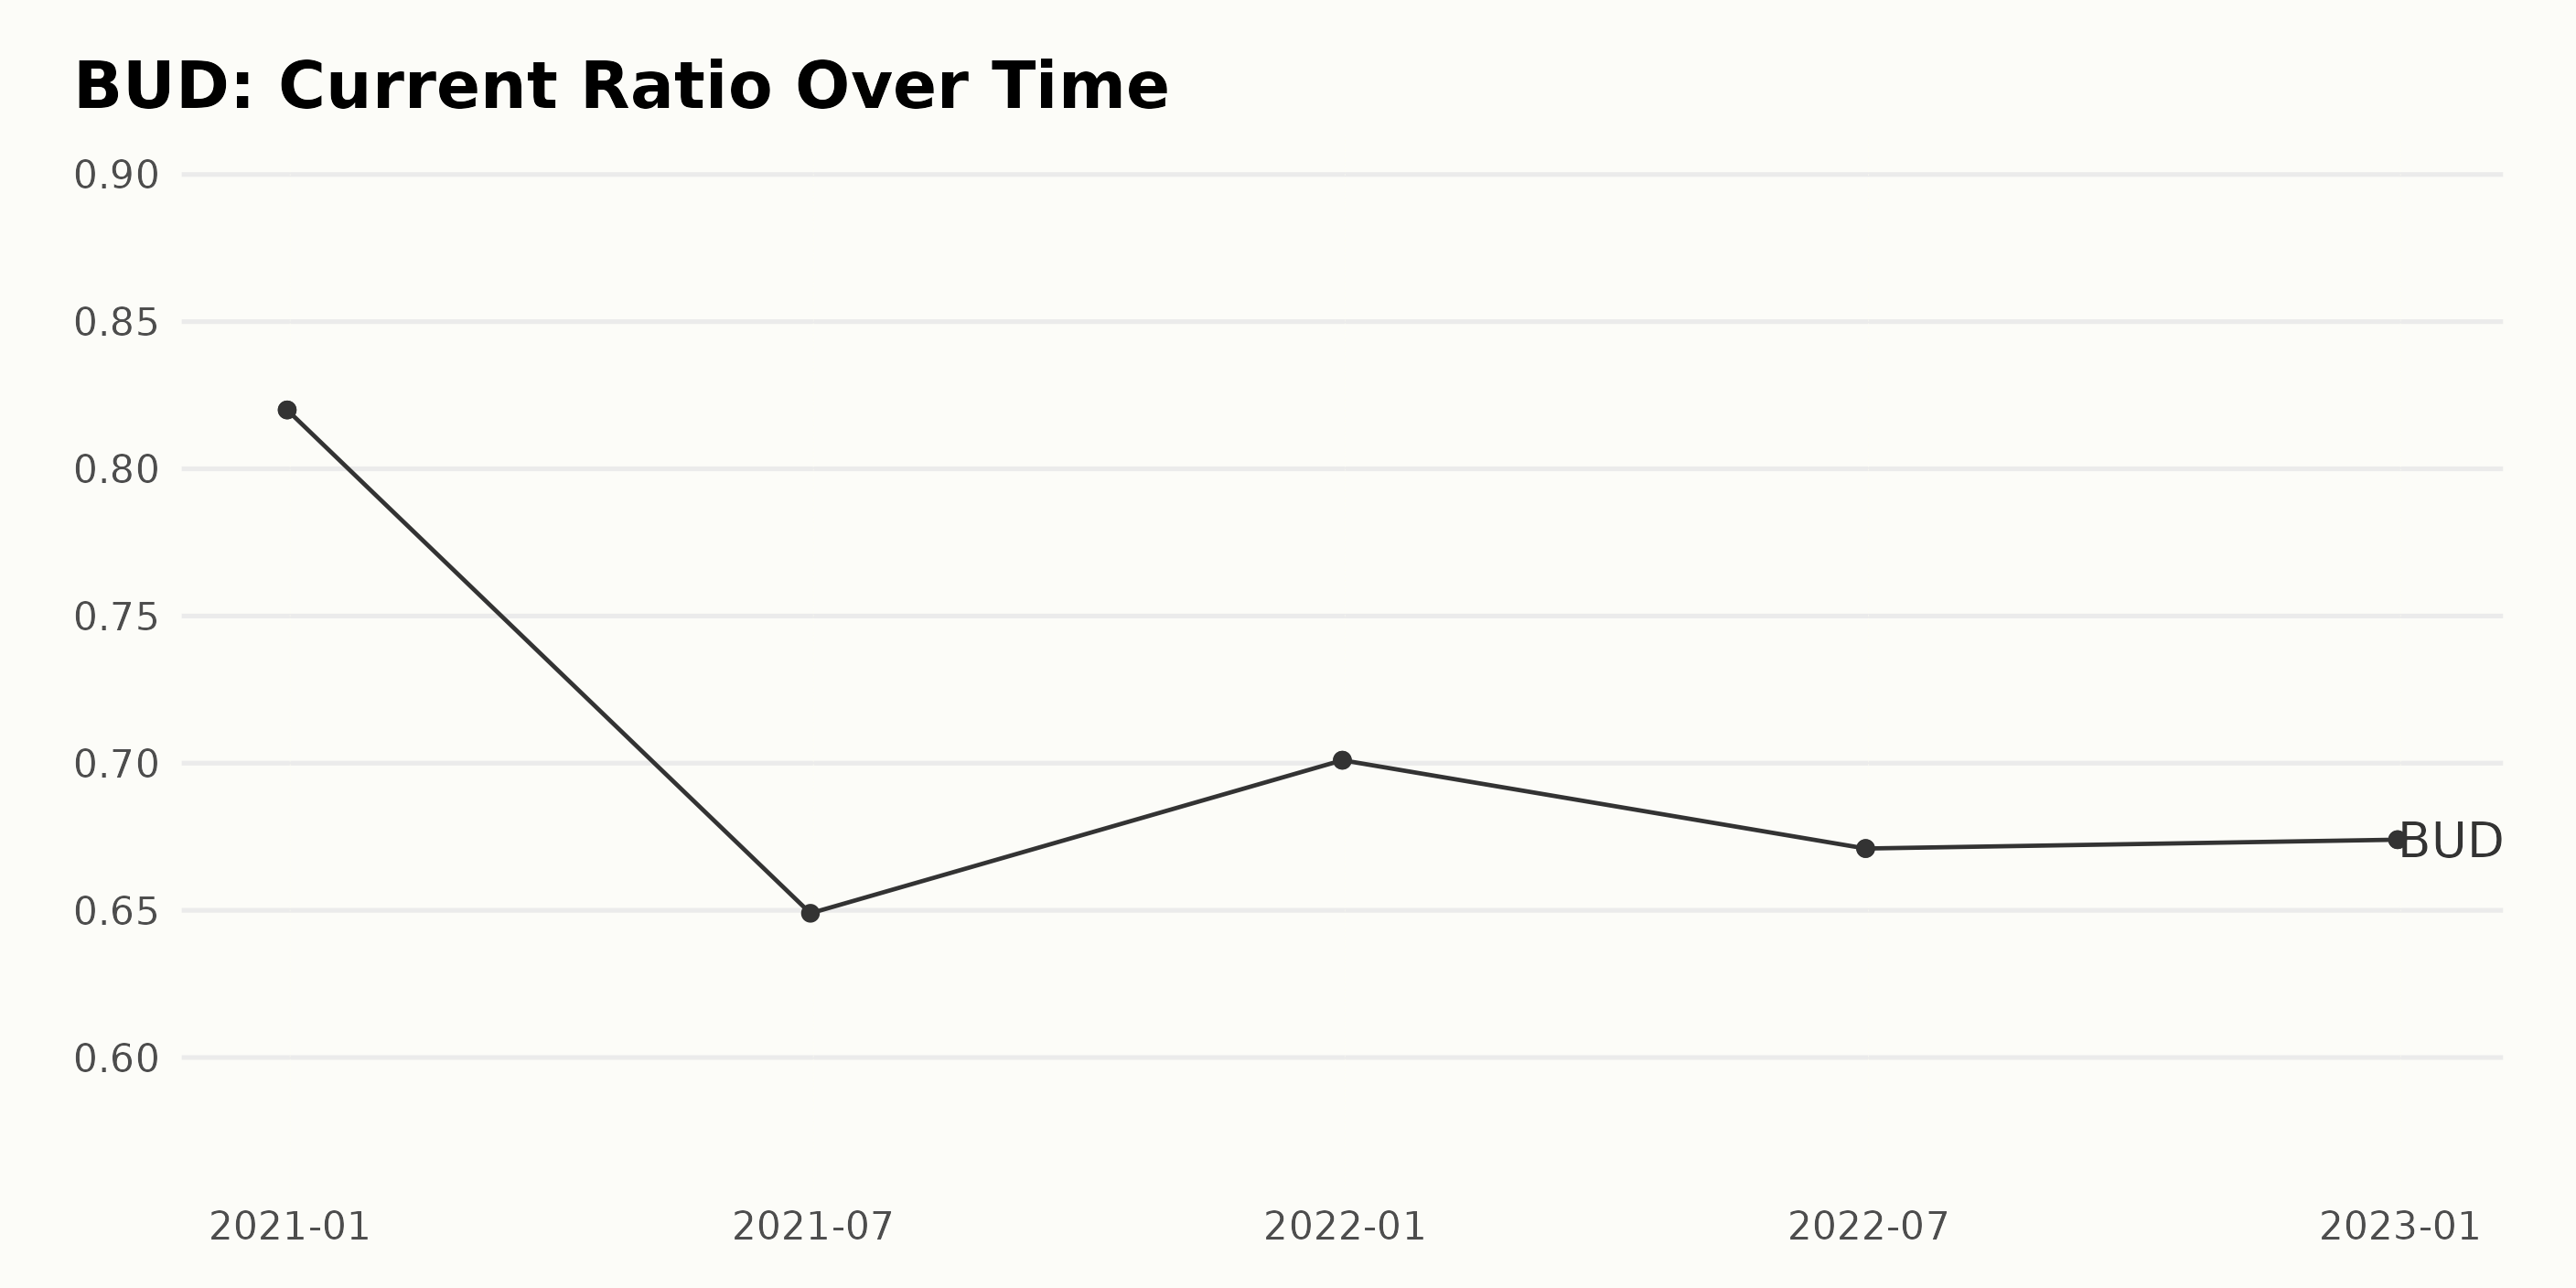
In examining the data provided, several distinct trends in BUD’S Current Ratio have emerged:
- Overall Decrement: The company’s CR showed an overall decrease from December 31, 2020 to December 31, 2022. The ratio was 0.82 at the end of 2020 and decreased to 0.67 by the end of 2022. This represents a significant decrement of approximately 18%.
- Intermediate Fluctuation: An intermediate decrease was observed from 0.82 on December 31, 2020 to 0.649 on June 30, 2021. However, it increased slightly in the second half of the year reaching 0.701 by December 31, 2021.
- Recent Fluctuation: In 2022, the CR stood at 0.671 as of June 30, which was a slight decrease from the 0.701 figure of December 31, 2021. But, by the end of the year, on December 31, 2022, the ratio showed a subtle increase, clocking in at 0.674.
Thus, these fluxes indicate that while BUD has been working to maintain solvency, the overall trend over the recent two-year period represents a decrease in BUD’s CR. For an investor, this might signify potential shifts in the company’s short-term financial stability or strategies towards maintaining liquidity.
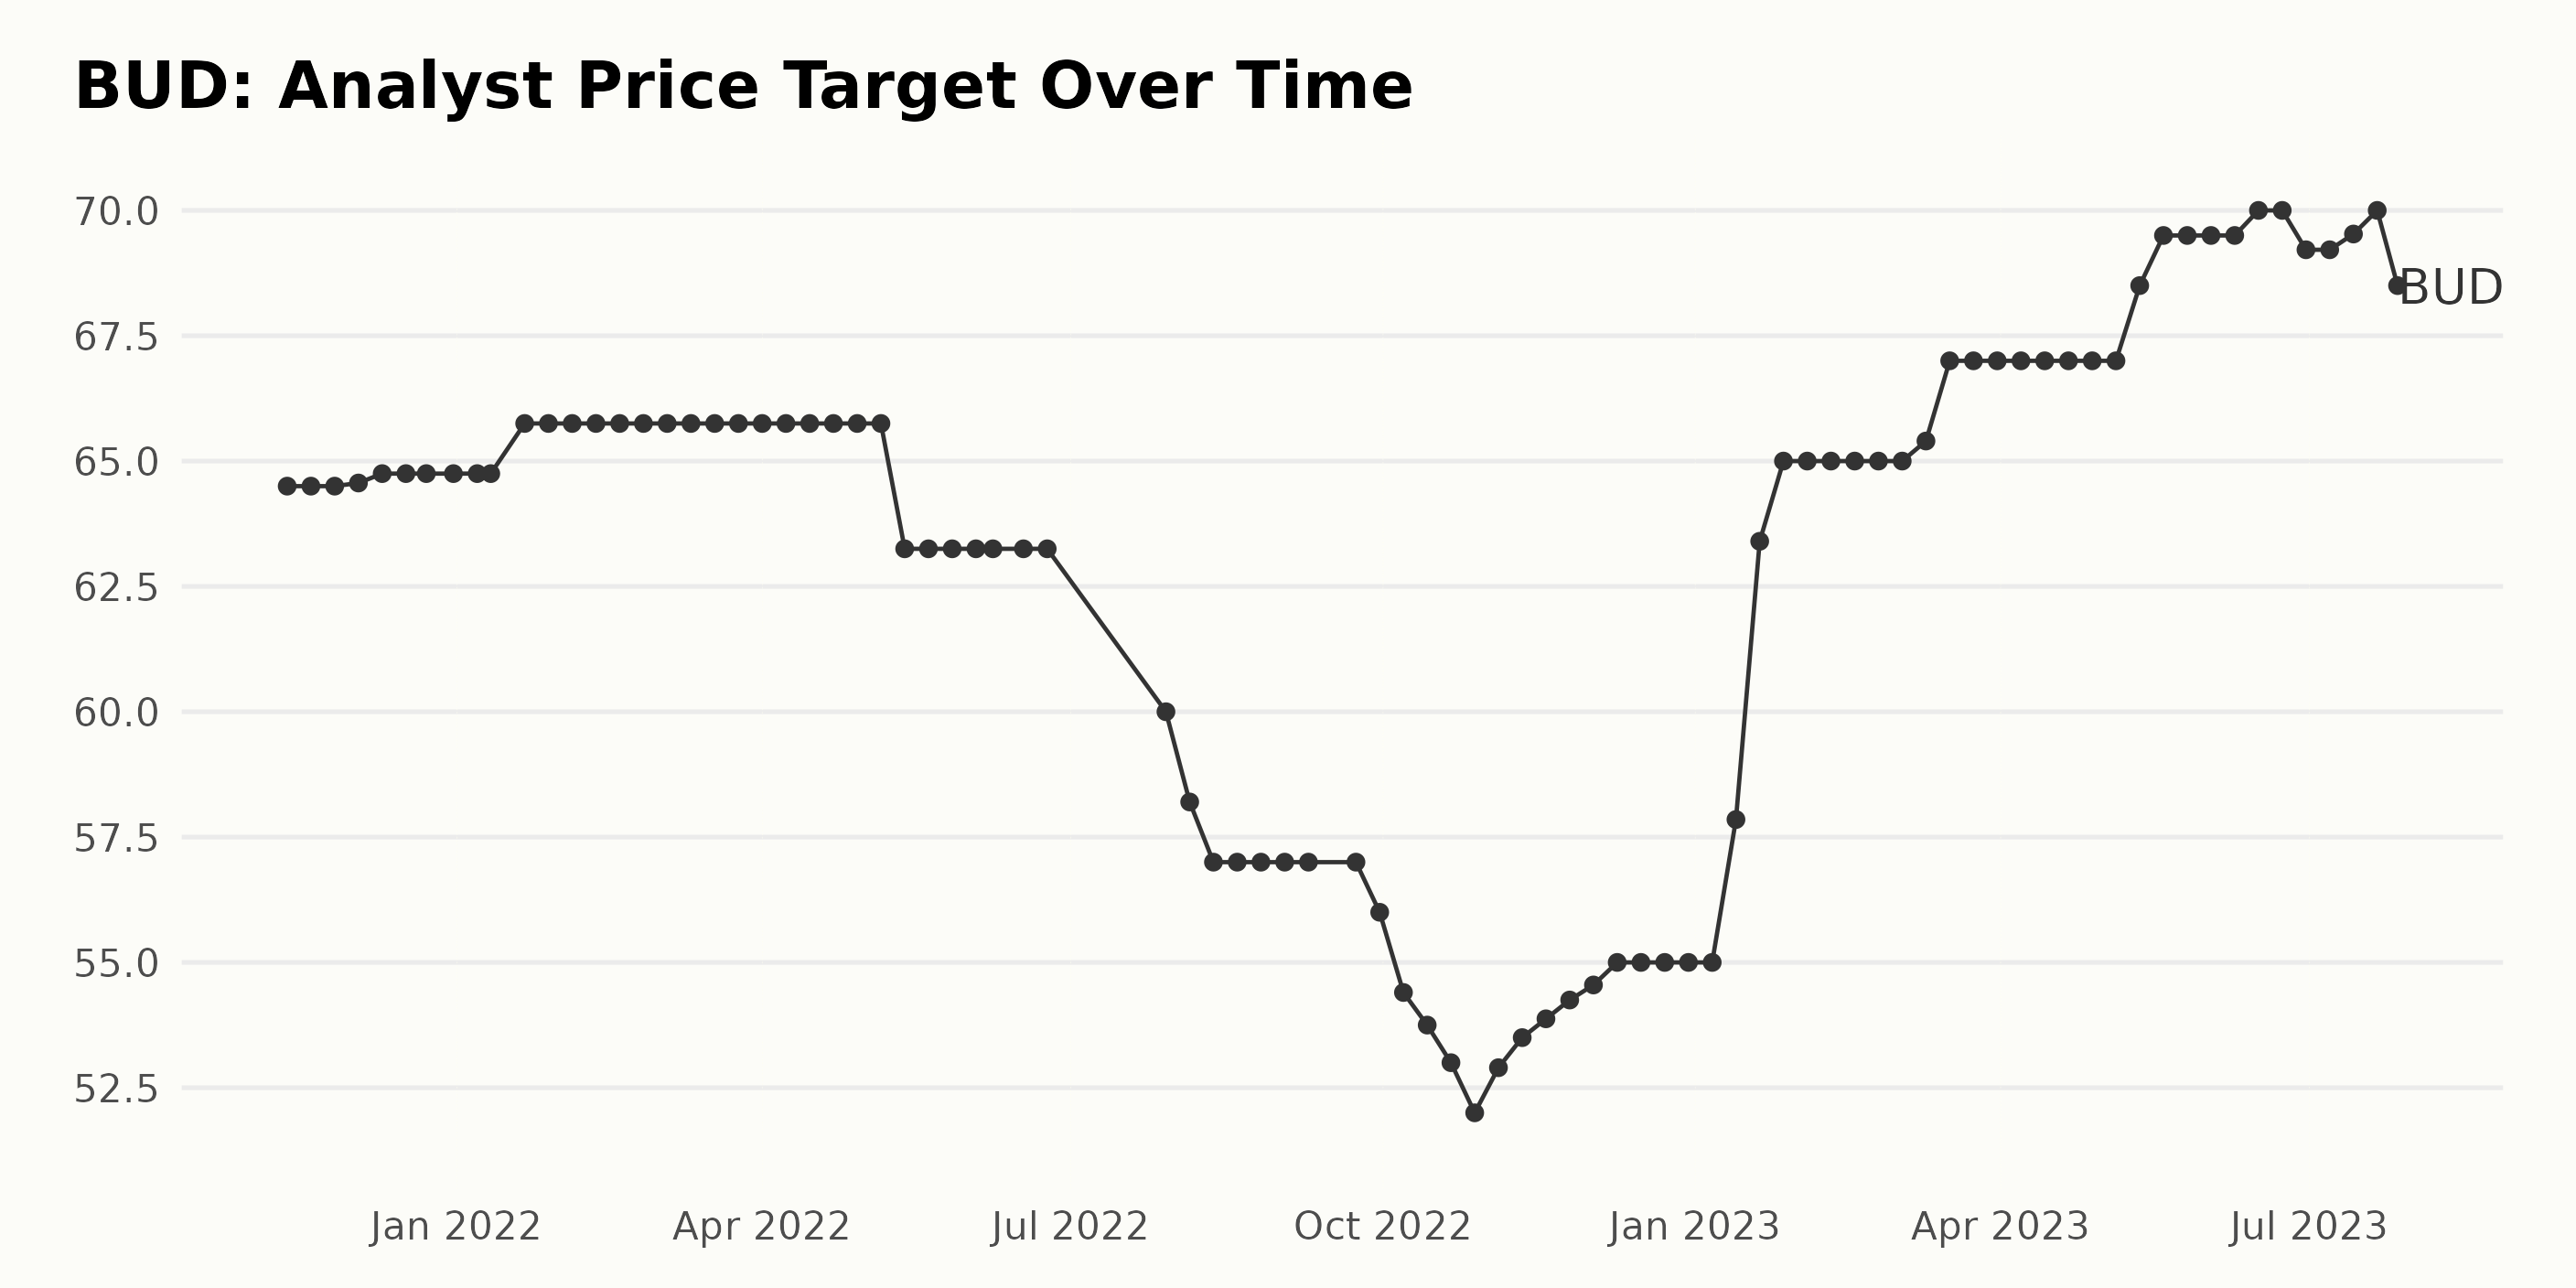
The Analyst Price Target for BUD showed different trends and fluctuations between November 2021 and July 2023.
From November 2021 to February 2022 there was a stable growth from $64.5 to $65.75, representing an increase of approximately 1.94%. It then dropped sharply to $63.25 in May 2023 and continued to decline, reaching its lowest point at $52 in October-November 2022, marking a decrease of 20.92% from the peak price in February.
In January 2023, the target price began a strong recovery, reaching $65 by February and continuing to rise to a high of $70 in June 2023. This represented a growth rate of nearly 34.62% from lowest price. However, it slightly reduced to $68.5 by the end of July 2023.
Looking at more recent data, the period from January 2023 to July 2023 saw some fluctuations with a generally upward trend. From $55 in January to $70 in June before decreasing to $68.5 by the end of July. The highest recorded value during these seven months was $70 in June, indicating a significant recovery compared to the prices in 2022.
The last recorded analyst price target for BUD in July 2023 was $68.5. Overall, although there were periods of decrease, the data reflects a long-term upward trend in the BUD’s Analyst Price Target from November 2021 to July 2023, with the most notable increase taking place between December 2022 and June 2023.
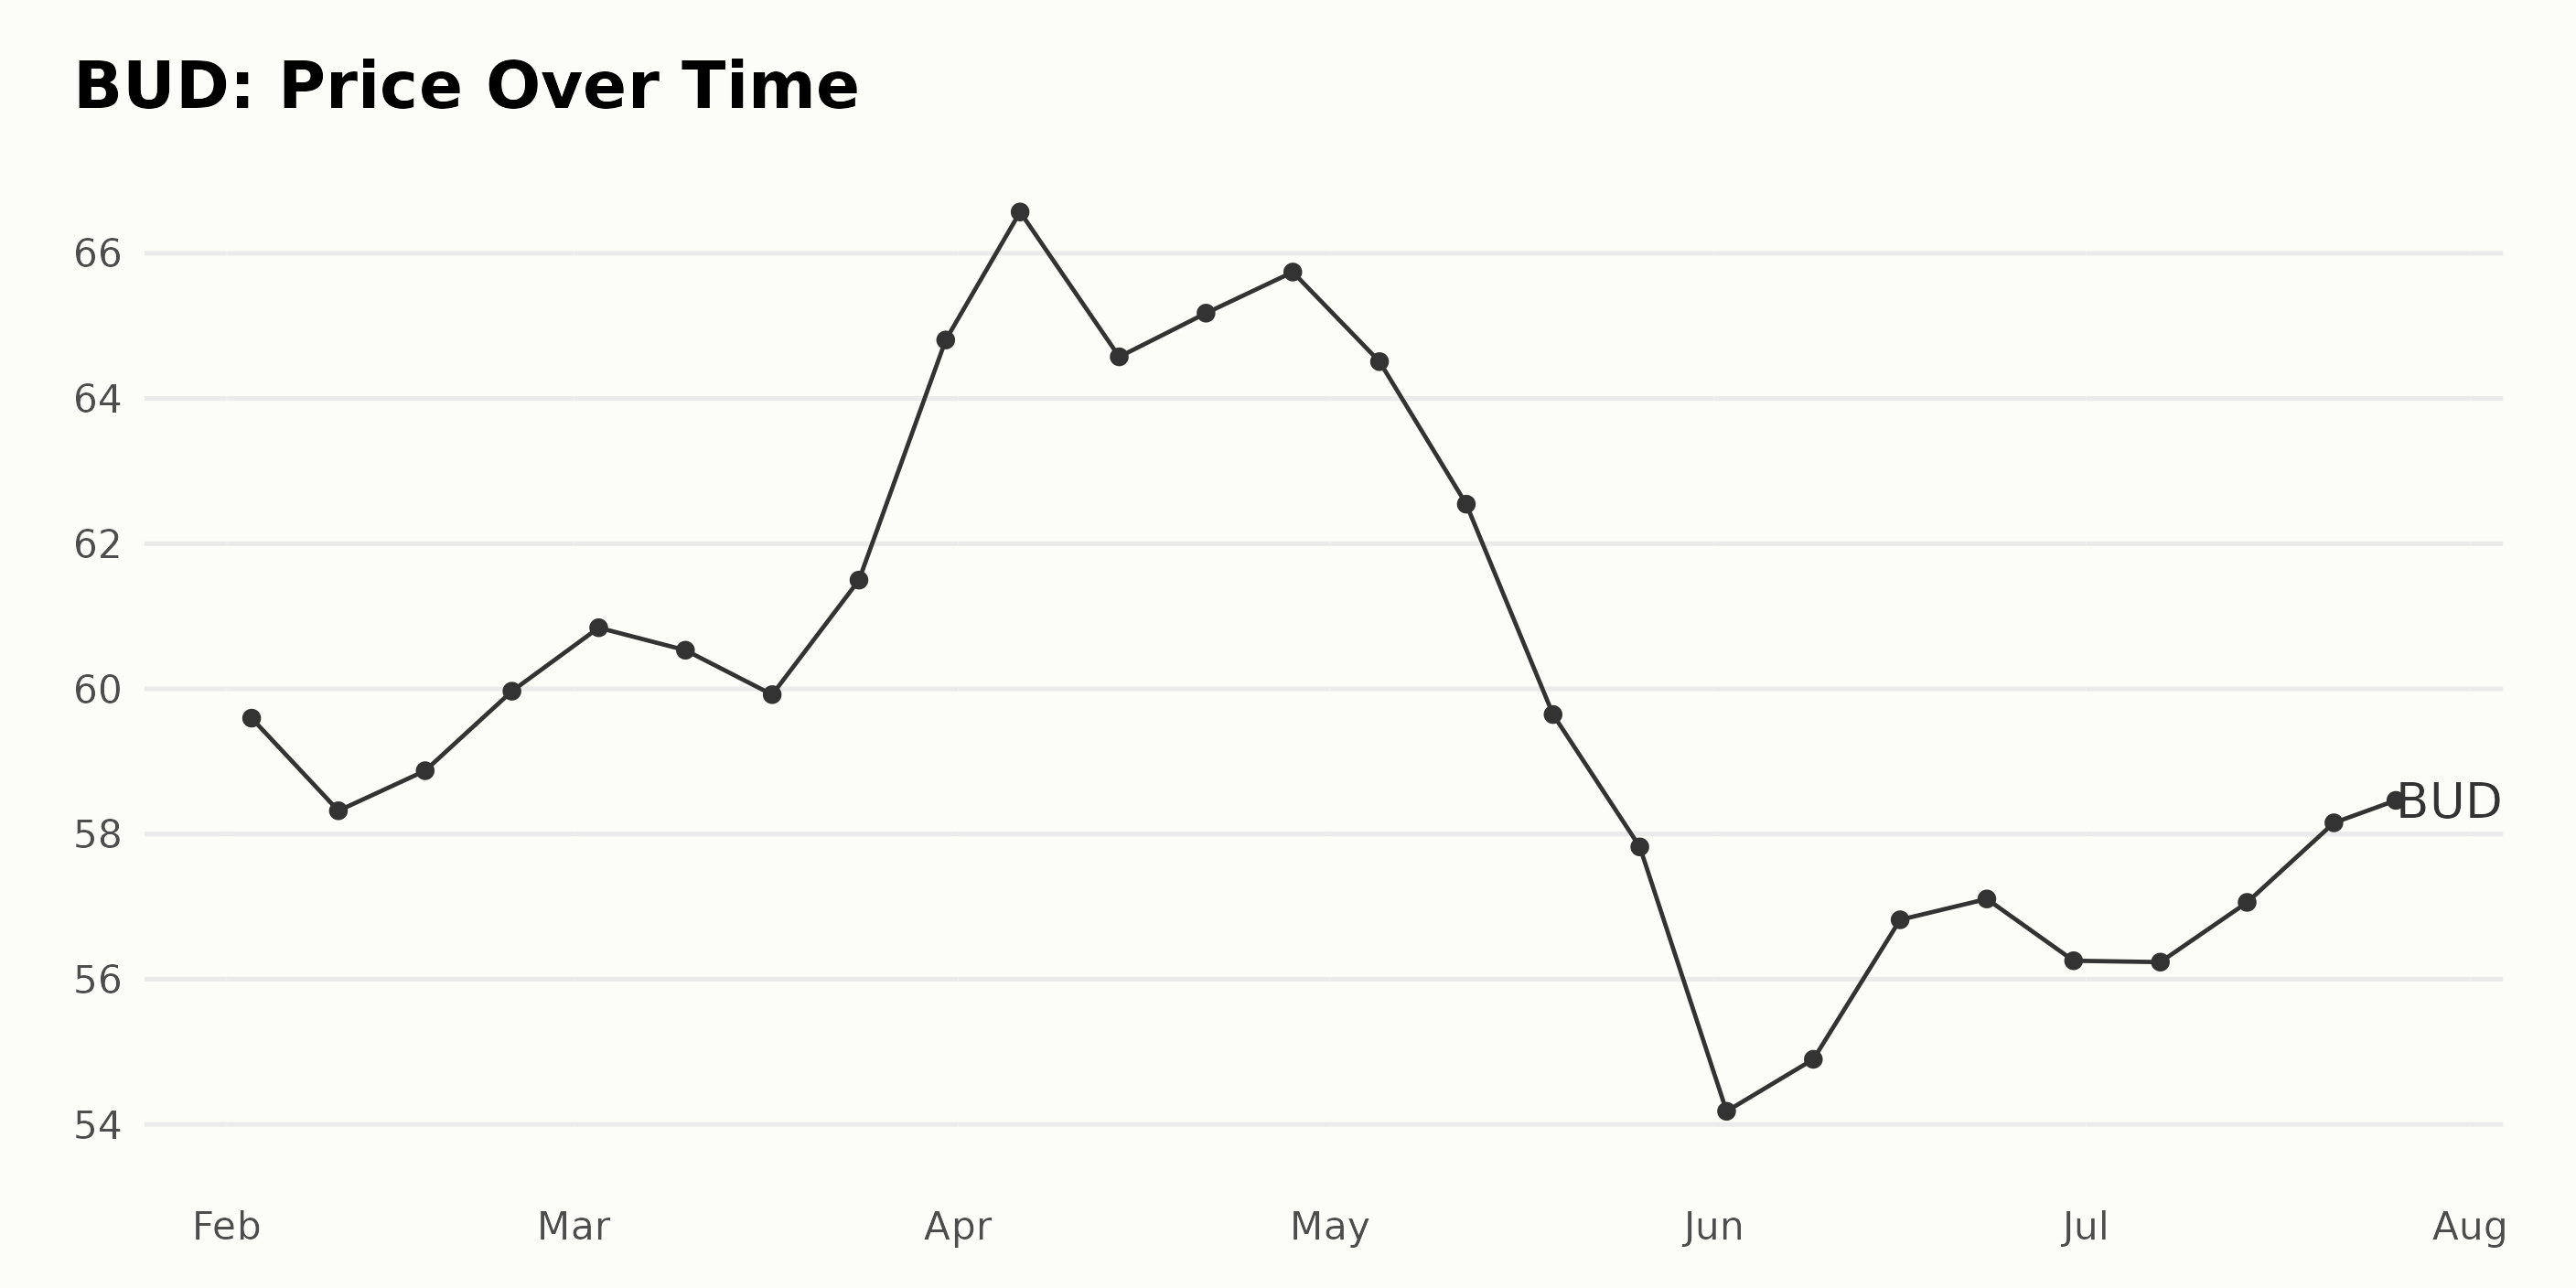
BUD’s Shares Display Volatility Through 2023’s First Half
- In February of 2023, BUD began at a price of $59.60. Over the month, it seems to fluctuate before settling around a slightly higher $59.97 by February 24.
- The following month, March, witnessed an upward trend, starting from $60.84 on the 1st and peaking at $64.81 on the 31.
- April 2023 saw this price peak maintained, with BUD’s share price growing to reach its highest value of $66.57 by April 6. However, the latter part of April saw a descent to around $65.74 by the end of the month.
- There was a notable decline in the share price for May 2023. Share prices fell from $64.51 at the start of the month to $57.82 by May 26.
- In June 2023, BUD’s shares continued to descend, reaching a low point of $54.18 on June 2. However, by the middle of the month, the company started recovering, albeit slightly, with shares closing at $56.25 on June 30.
- July of 2023 showed a small but consistent increase in value, from $56.24 at the beginning of the month to close the period at a relatively higher price on July 26, at $58.46.
Overall, BUD’s shares price data illustration shows a somewhat volatile trend during these months. The stock began growing during the first trimester of the year 2023, then it went through a decline in the second trimester, before eventually seeing a slight recovery by the end of July 2023. Here is a chart of BUD’s price over the past 180 days.
Assessing BUD’S POWR Ratings:
BUD has an overall B rating, translating to a Buy in our POWR Ratings system. Based on the given data, BUD’s POWR Ratings have shown improvement over time in the Beverages category of stocks, which comprises 37 stocks in total, and BUD is ranked #15.
Here is a summary of the changes over time:
- Starting from the week of January 28, 2023, BUD had a POWR Ratings of C, with its category rank floating in the low twenties.
- By the week of March 4, 2023, the rating improved to an A while its rank significantly dropped to 7, indicating a better position.
- This A rating persisted until mid-May 2023, though the rank oscillated between 7 and 9 following April 15, 2023.
- From the week of May 13, 2023, the POWR Ratings was downgraded to a B. There was an upward trend seen in the rank in the category, which slowly rose to the high teens by July 2023.
As of the latest data date on July 26, 2023, BUD’s POWR grade is B, with a rank of 14 in the Beverages category. This suggests BUD’s performance is above average within this category.
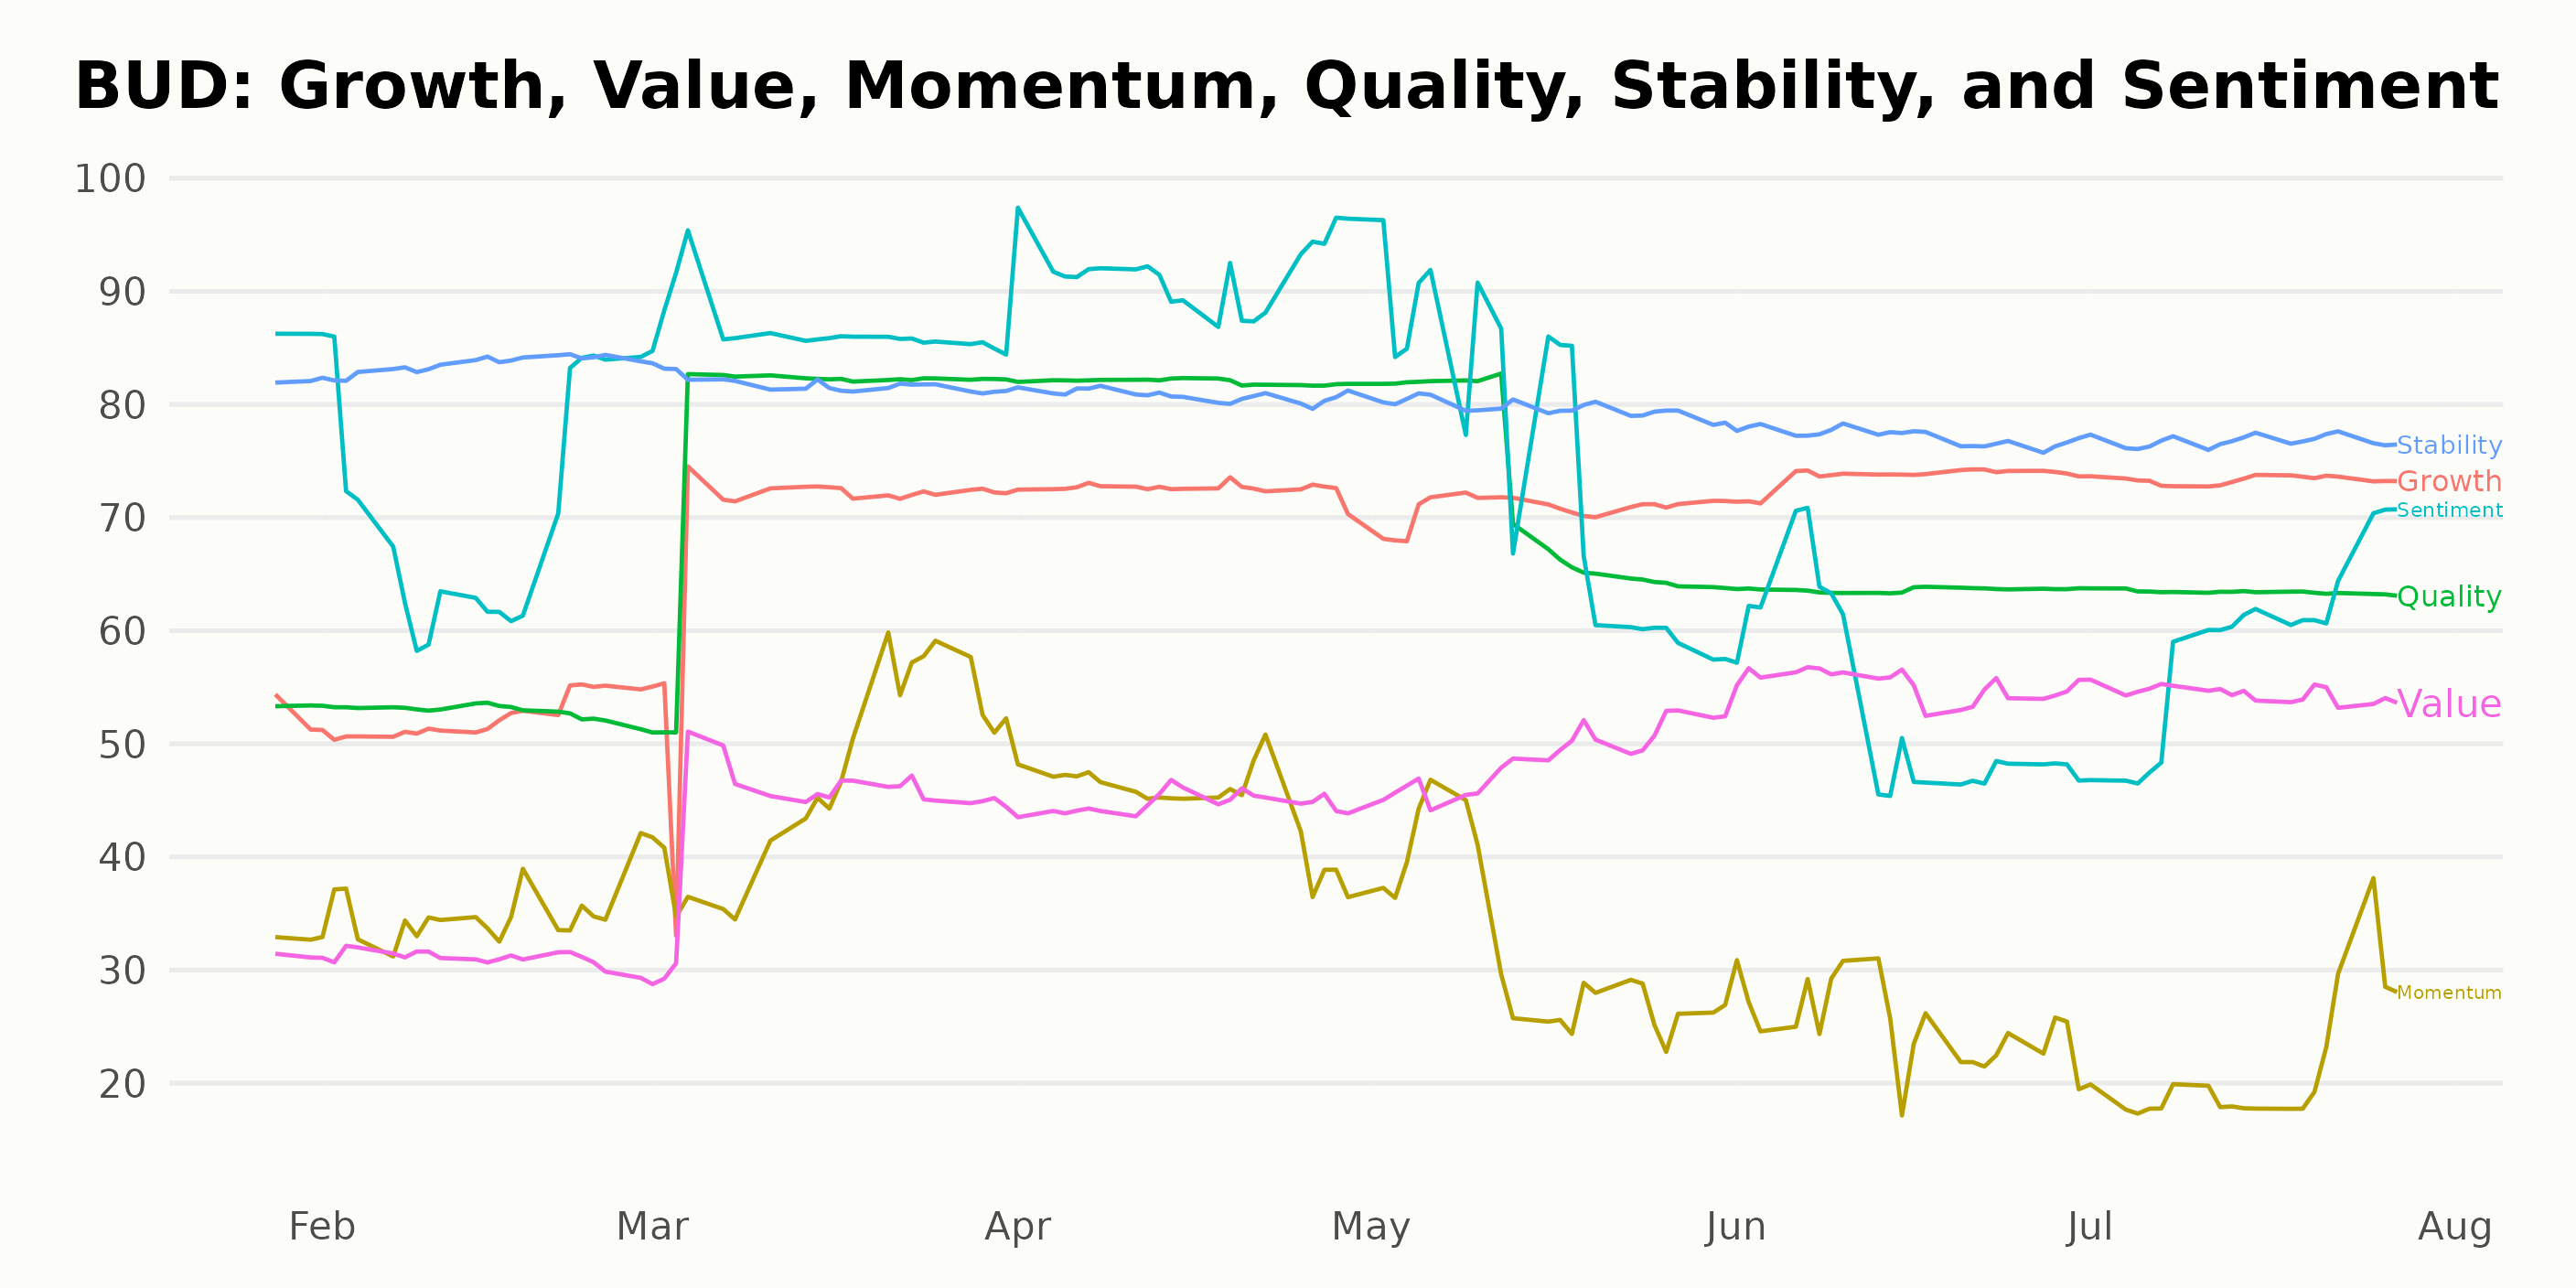
Based on the POWR ratings for BUD along the six dimensions, the three most noteworthy ones are Sentiment, Stability, and Growth.
- Sentiment: This dimension recorded the highest ratings consistently during the period under review. It started at 86 in January 2023, dropped to 71 in February, and rebounded back to 86 by March. Its peak value was 92 in April 2023 before a gradual decline set in, reaching 53 by June and exhibiting a slight recovery to 58 by July 2023.
- Stability: Another key dimension with high ratings during this period was Stability. Its ratings hovered around the 80s, ranging from 82 in January and February 2023, down to 81 in April, and further dropped slightly through May, June, and July 2023 when it reached 77.
- Growth: Notably, the Growth dimension reflected prominent changes and exhibited a clear upward trend over time. From a starting score of 53 in January 2023, it gradually rose to a peak at 74 in June. Despite a slight drop to 73 in July, the overall growth was still positive and of note.
These three dimensions, Sentiment, Stability, and Growth illustrate a comprehensive performance evolution of BUD over the given timeframe.
How does Anheuser-Busch InBev SA/NV (BUD) Stack Up Against its Peers?
Other stocks in the Beverages sector that may be worth considering are Coca-Cola Bottling Co. Consolidated (COKE), Suntory Beverage & Food Ltd (STBFY), and Embotelladora Andina S.A. (AKO.B) -- they have better POWR Ratings.
What To Do Next?
Get your hands on this special report with 3 low priced companies with tremendous upside potential even in today’s volatile markets:
3 Stocks to DOUBLE This Year >
BUD shares were trading at $58.76 per share on Thursday afternoon, up $0.07 (+0.12%). Year-to-date, BUD has declined -1.19%, versus a 20.65% rise in the benchmark S&P 500 index during the same period.
About the Author: Kritika Sarmah

Her interest in risky instruments and passion for writing made Kritika an analyst and financial journalist. She earned her bachelor's degree in commerce and is currently pursuing the CFA program. With her fundamental approach, she aims to help investors identify untapped investment opportunities.
The post Are Investors Buying Shares of Anheuser-Busch InBev (BUD)? appeared first on StockNews.com