
Twilio Inc. (TWLO) operates a cloud communications platform that enables developers to build and operate customer engagement within software applications. Recently, the company deepened its relationship with Amazon Web Services (AWS) to inject predictive Artificial Intelligence (AI) capabilities into TWLO’s newly-launched Customer AI, which might enhance its customer engagement.
On the other hand, the company’s second-quarter revenue forecast came below expectations, likely due to slowing demand for cloud services. TWLO expects second-quarter revenue between $980 million to $990 million, compared with the analysts’ estimate of $1.05 billion. Moreover, in line with the tech layoffs earlier this year, TWLO reported laying off about 17% of roles and closing some offices.
Given this backdrop, let’s take a look at the trends of TWLO’s key financial metrics to understand why it could be wise to wait for a better entry point in the stock.
Twilio Inc.’s Financial Ups and Downs: Tracking Profits, Revenues, and Investor Confidence
Reviewing the available financial data for TWLO, we can observe a significant trend in its trailing-12-month net income, which has experienced considerable fluctuations over the past couple of years:
- On September 30, 2020, TWLO reported a net income of -$401.88 million.
- By the end of that year, on December 31, 2020, its net loss had increased to -$490.98 million, illustrating a declining pattern in its financial performance.
- Throughout 2021, this downward trend continued, with TWLO reporting net losses of -$602.73 million, -$730.66 million, -$837.85 million, and -$949.90 million for the respective consecutive quarters.
- In the first quarter of 2022, the net loss slightly increased to -$964.99 million.
- Jumps in net losses continued to be evidenced throughout the rest of 2022, with figures of -$1.06 billion, -$1.32 billion. However, it's notable that as of December 31, 2022, the net loss scaled down slightly to -$1.26 billion.
- The last provided data on March 31, 2023, shows further growth of the net loss, reaching -$1.38 billion.
Over this period, the net income of TWLO exhibits a generally negative growth rate, indicating an increasing net loss from September 30, 2020, to March 31, 2023. Based on the first and last data points, the growth rate is approximately 243%, reflecting an intensification of financial strain on the company.
The emphasis on more recent data, particularly the last data point, clearly marks a notable increase in the company's loss margins. This data suggests that TWLO has faced heightened financial challenges recently.

The trailing-12-month revenue of TWLO has experienced a reasonably stable growth trend over the years, from September 2020 to March 2023. The following points outline the key features of this trend.
- In September 2020, the revenue was approximately $1.54 billion.
- By the end of 2022, the company's revenue had grown to $3.82 billion, showing a healthy growth trend.
- In the first quarter of 2023, revenue was slightly increased compared to the last quarter of 2022, reaching approximately $3.96 billion.
- The revenue steadily increased each quarter, with no significant dips during the periods under observation.
Given this data, TWLO's total revenue growth rate from September 2020 to March 2023 is approximately 156.69%, which demonstrates a strong upward trend. The largest quarterly jump was noticed between the first and second quarters of 2021, when the value increased from $1.99 billion to $2.25 billion, signifying notable growth within that time frame.
However, the company's most recent quarter revenues are still growing, showing signs of a slight deceleration. It is recommended to monitor subsequent quarterly reports to understand if the slowdown is a temporary fluctuation or indicative of a longer-term trend.

The data series represents TWLO asset turnover from September 30, 2020, to March 31, 2023.
- On September 30, 2020, asset turnover was 0.28.
- There was a steady downward trend until June 30, 2021, when it reached a low of 0.22.
- From there, TWLO saw a steady increase in asset turnover, reaching 0.30 by December 31, 2022.
- The latest data point on March 31, 2023, shows that the asset turnover continued upward to 0.31.
The trajectory of the data suggests a rebounding pattern for TWLO's asset turnover after the second quarter of 2021. The growth rate calculated using the initial and the final value of this data series shows an increase of approximately 8.4%.

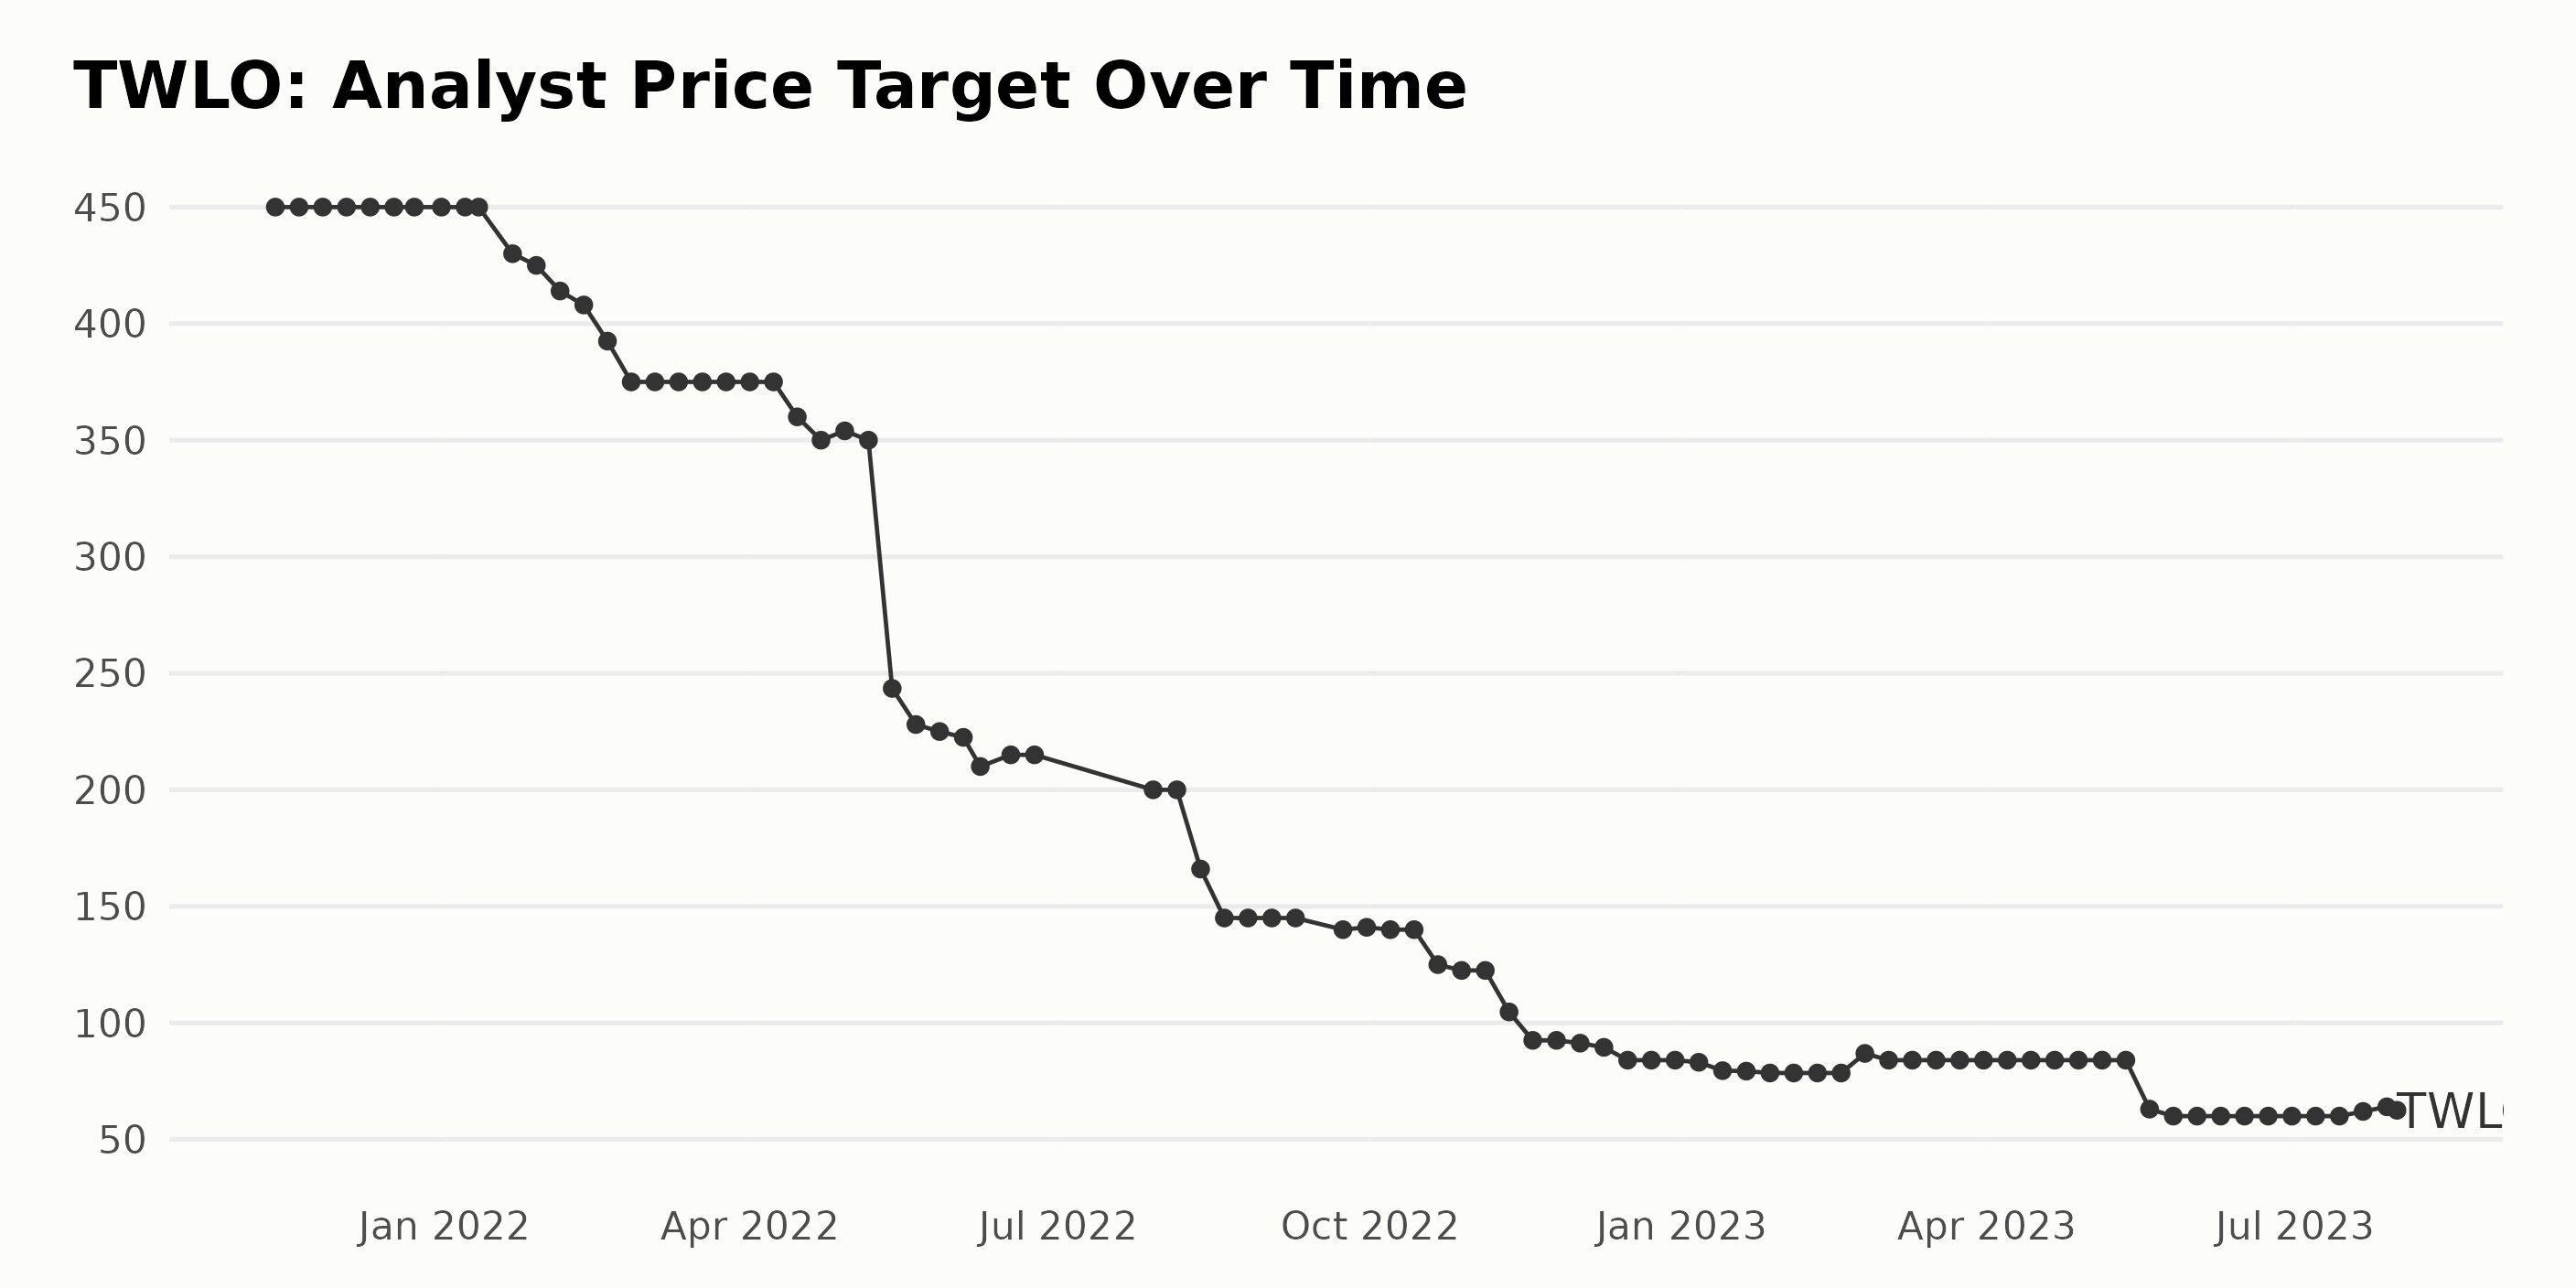
The trend and fluctuations of the analyst price target of TWLO from November 2021 to July 2023 demonstrate significant changes.
- From November 2021 to January 2022, the analyst price target remained stable at $450.
- Then, there was a noticeable gradual decline between February 2022 and May 2022 from $414 to $222.5.
- Another sharp drop was observed in mid-May 2022, from $243.5 to $210 in June 2022.
- There was a slight increase in mid-June 2022, reaching $215, but then decreased again by the end of July 2022 to $200.
- The price continued to trend downward from September 2022 to November 2022, where the analyst price target went from $145 to $92.5.
- This downward trend continued into December 2022 and reached its lowest at $79.3 in January 2023.
- A small recovery was observed by the end of February 2023, where the analyst price target rose to $86.9 but then stabilized back to $84 from March 2023 until mid-May 2023.
- Lastly, a substantial decrease was seen again in mid-May, with the analyst price target falling drastically to $60 by June 2023 and maintaining that level until mid-July. However, a small recovery was observed at the end of July 2023, with the target increasing to $62.5.
The growth rate, calculated from the first value to the last, indicates an approximately -86.11% growth rate. This shows a significant overall decline in the analyst price target of TWLO over this period.
Twilio Inc. Shares: Fluctuating Trend from February to July 2023
The TWLO share prices from February to July 2023 suggest a fluctuating trend with sustained increase and decrease periods.
- In early February 2023, the share price stood at $63.19, which decreased slightly to $61.78 by mid-February. There was short-lived growth afterward, reaching $67.47 on February 17 before dropping back to $65.44.
- In March 2023, there was an upward trajectory at the beginning of the month, with the share price increasing from $68.38 to its highest value of $71.53. However, this was followed by a steady decline the rest of the month, with the share price ultimately ending at $63.33 by the end of March.
- Most of April and May were marked by weekly decreases in the share price, culminating in the lowest price over this period of $48.06 in mid-May. The share price then rebounded significantly, jumping to $59.58 in late May and further to $66.54 in early June.
- The rest of June saw minor fluctuations around the mid-$60s range, with a slight drop off in the last week to $64.04.
- In July, the share price showed a minuscule net decrease, moving from $63.58 at the start of the month to $62.02 at the end, despite slightly rising in the middle of the month to $66.07.
Thus, while shares experienced periods of growth, such as early March and late May, there also were periods of deceleration, seen most markedly from April to mid-May. The overall trend from February to July 2023 does not show a consistent or constant rate of growth or decline. Here is a chart of TWLO's price over the past 180 days.

Analysis of Twilio Inc.’s Growth, Sentiment, and Value Ratings in 2023
The POWR Ratings grade of TWLO, a stock in the Software - SAAS category, has seen some changes over time:
- It had a POWR grade of D (Sell) in the week of February 4, 2023, with a rank in the category at #22 out of 26.
- The same grade and rank were maintained in the week of February 11, 2023.
- Starting from the week of February 18, 2023, the POWR grade improved to C (Neutral). At this point, the rank in the category slightly improved to #21.
- Between the weeks of February 25 and March 25, 2023, the POWR grade remained C (Neutral), while the rank in category varied between #20 and #21.
- From April 1 to July 15, 2023, the POWR grade remained at C (Neutral), with the rank in the category improving to as high as #18 (week of April 22, 2023) and later declining to #23 (week of July 15, 2023).
As of the most recent data point as of July 31, 2023, TWLO's POWR grade is C (Neutral), and its rank within its category is #24.
Based on the POWR Ratings provided for TWLO, the three most noteworthy dimensions are Growth, Sentiment, and Value.
Growth: This dimension consistently holds the highest ratings across the given months. There is a clear trend of upward Growth from 73 in February 2023 to a steady 84 from March 2023 through July 2023.
Sentiment: The Sentiment rating sees noticeable fluctuation over this time frame. The rating starts from 62 in February 2023, peaks at 83 in April 2023, and then descends to 59 by July 2023.
Value: The Value dimension is the third most noteworthy, as its ratings maintain relatively high values. Similar to Sentiment, it also rises and falls within this period. It begins with 62 in February 2023 and reaches the highest point of 67 in May 2023 before moving down to 61 by July 2023.
In conclusion, the Growth dimension for TWLO is its strongest asset, while Sentiment and Value show clear, although somewhat unstable, trends across these months in 2023.

How does Twilio Inc. (TWLO) Stack Up Against its Peers?
Other stocks in the Software - SAAS sector that may be worth considering are The Sage Group plc (SGPYY), Informatica Corp (INFA), and Splunk Inc. (SPLK) - they have better POWR Ratings.
What To Do Next?
Discover 10 widely held stocks that our proprietary model shows have tremendous downside potential. Please make sure none of these “death trap” stocks are lurking in your portfolio:
TWLO shares were trading at $65.74 per share on Monday afternoon, up $1.68 (+2.62%). Year-to-date, TWLO has gained 34.27%, versus a 20.42% rise in the benchmark S&P 500 index during the same period.
About the Author: Anushka Dutta

Anushka is an analyst whose interest in understanding the impact of broader economic changes on financial markets motivated her to pursue a career in investment research.
The post Is Twilio Inc. (TWLO) a Wise Pick for August? appeared first on StockNews.com